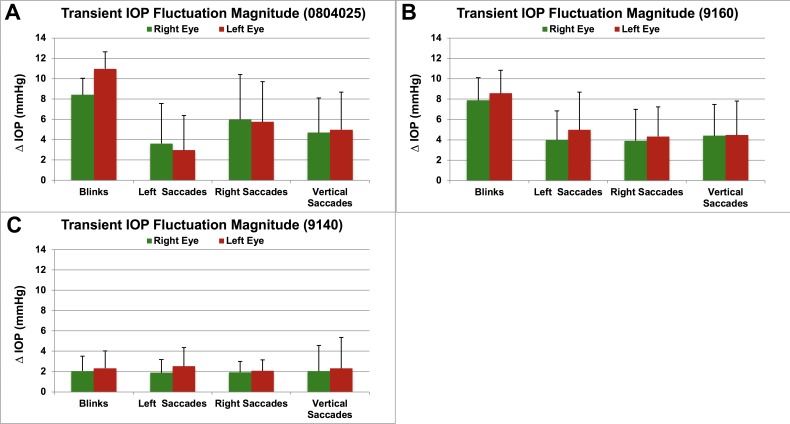
Figure 4.
Mean transient IOP fluctuation magnitude above baseline for blinks and saccades for each NHP (A–C) (ID in parentheses), quantified in ∼12 hours of video (2 hours of video for each of two sessions in each NHP, at least 1 week apart). Error bars represent the standard deviation. Saccades are separated by direction to show that magnitudes are similar for each direction of saccade within eyes and between fellow eyes in each animal. All NHPs were of similar age (4.5 to 5 years old).

