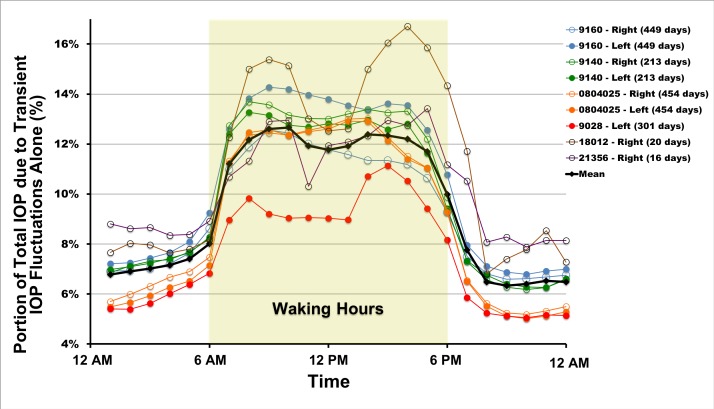
Figure 6.
Mean hourly IOP transient impulse, plotted as a percentage of total IOP, for all eyes of all animals. The plotted values are a measure of the amount of energy the eye must withstand from transient IOP fluctuations relative to the total IOP energy the eye must absorb. The number of days of data used is indicated in the legend. Waking hours are highlighted (6AM–6PM).

