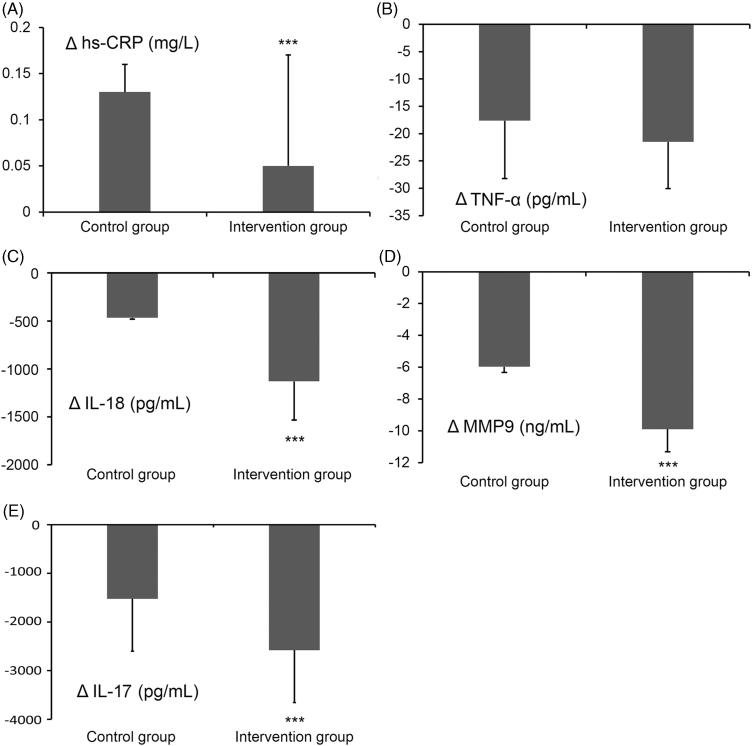
Figure 2.
Differences of inflammatory factor serum concentrations in the control and intervention groups before and 3 months after the initiation of therapy. (A) Increase of hs-CRP, (B) decrease of TNF-α, (C) decrease of IL-18, (D) decrease of MMP9 and (E) decrease of IL-17. ***p < 0.001 between the control and intervention group.

