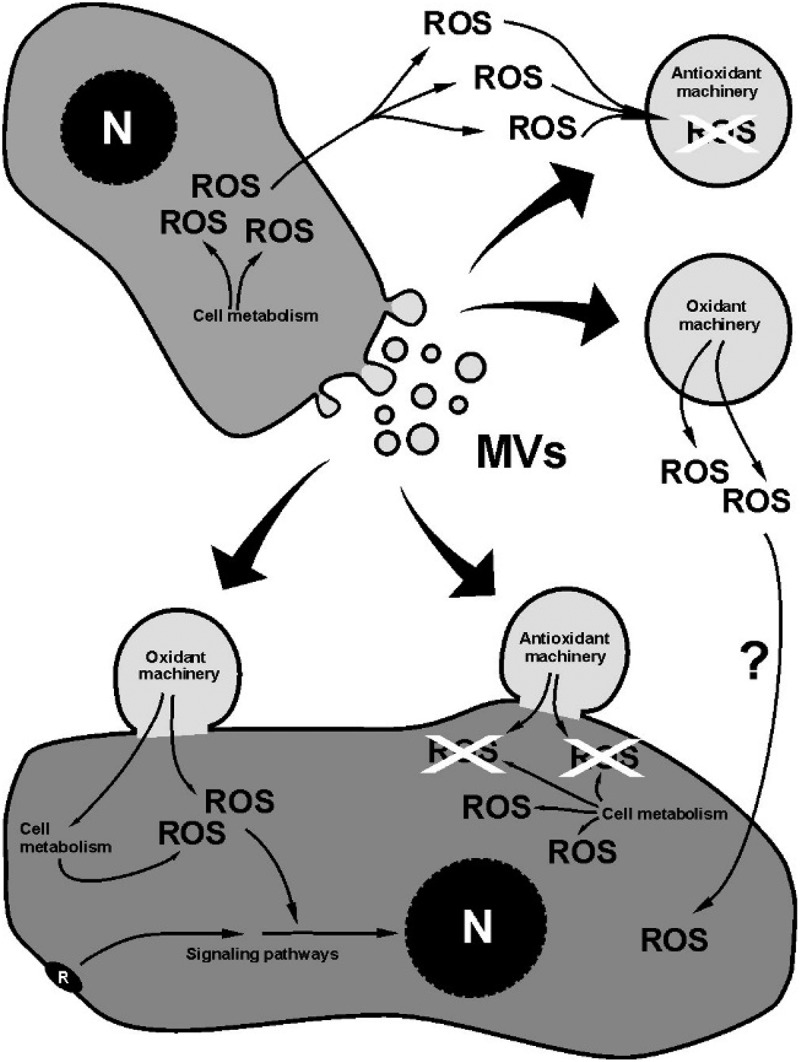
Figure 2.

Schematic drawing showing the main effects of MVs on ROS. At the top, the direct effect of MVs; at the bottom, the indirect (cell-mediated) effect. The effect of ROS- regulated signaling pathways on the ROS content of the cell is not included.
