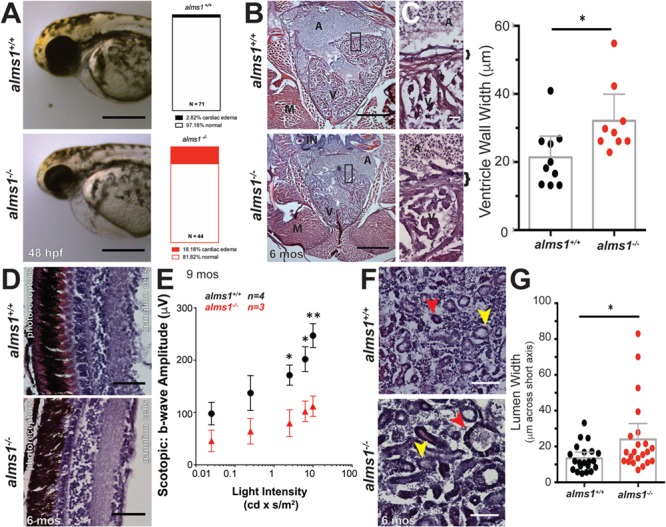
Figure 2.

alms1−/− zebrafish display multiple defective organ systems. (A) Representative images of alms1+/+ and alms1−/− larvae showing severe cardiac edema at 48 h post-fertilization. Scale bar, 1 mm. Quantification of cardiac edema rates in alms1+/+ (n = 71) and alms1−/− (n = 44) larvae. Significance, chi-squared, ****P < 0.0001. (B) H&E sections from alms1+/+ and alms1−/− zebrafish at 6 months showing gross structure in the heart. Scale bar, 500 μm. A, atrium; V, ventricle; M, muscle; IN, intestine. (C) H&E sections from alms1+/+ and alms1−/− zebrafish showing high magnification of ventricular wall. Quantification of thickness of ventricular wall in alms1+/+ and alms1−/− animals (n = 4 animals). Bracket, ventricular wall. Scale bar, 25 μm. A, atrium; V, ventricle. Dots, individual measurements; error bars, 95% CI. (D) Representative images of H&E staining of retinal layers from alms1+/+ and alms1−/− zebrafish at 6 months showing degradation of multiple retinal layers in alms1−/− animals. Retina directionality indicated by photoreceptor and ganglion cell sides. Scale bar, 50 μm. (E) Quantification of scotopic b-wave amplitudes in response to light stimulation from alms1+/+ (n = 4) and alms−/− (n = 3) zebrafish at 9 months of age. Error bars, 95% CI. (F) Representative H&E images of kidneys in alms1+/+ and alms1−/− animals at demonstrating the abnormal shape and size of kidney tubules in alms1−/− animals. Distal tubule, yellow arrow; proximal tubule, red arrow. Scale bar, 100 μm. (G) Lumen width along short axis in kidneys from alms1+/+ and alms1−/− animals (n = 4 animals). Error bars, 95% CI. Where indicated, *P < 0.05, **P < 0.01.
