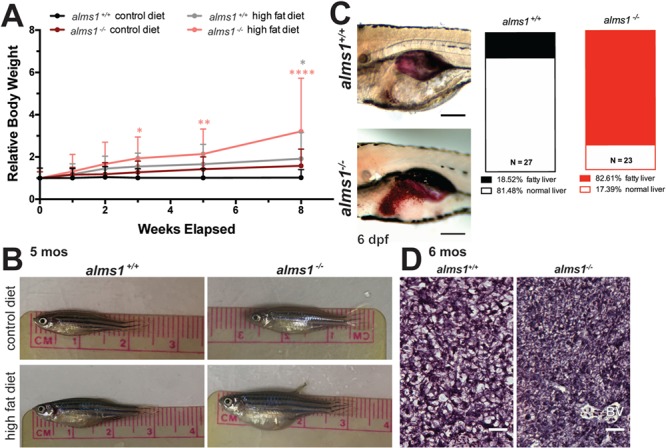
Figure 3.

alms1−/− zebrafish exhibit increased weight gain and systemic metabolic defects. (A)alms1+/+ and alms1−/− zebrafish adults at 3 months were fed daily with set weights of either maintenance diet (control) or overfeeding with HF diet for 8 weeks (n = 4–6 animals per condition). Statistics, two-way ANOVA compared to alms1+/+ control diet. (B) Representative images of alms1+/+ and alms1−/− zebrafish after 8 weeks of either control diet or HF diet. (C) Representative images of Oil Red O staining in livers of alms1+/+ (n = 27) and alms1−/− (n = 23) larvae at 6 dpf. Scale bar, 500 μm. Quantification of Oil Red O positive livers. Significance, chi-squared. (D) Representative regions of sectioned H&E liver tissue from alms1+/+ and alms1−/− zebrafish at 6 months. Scale bar, 25 μm. BV, blood vessel.
