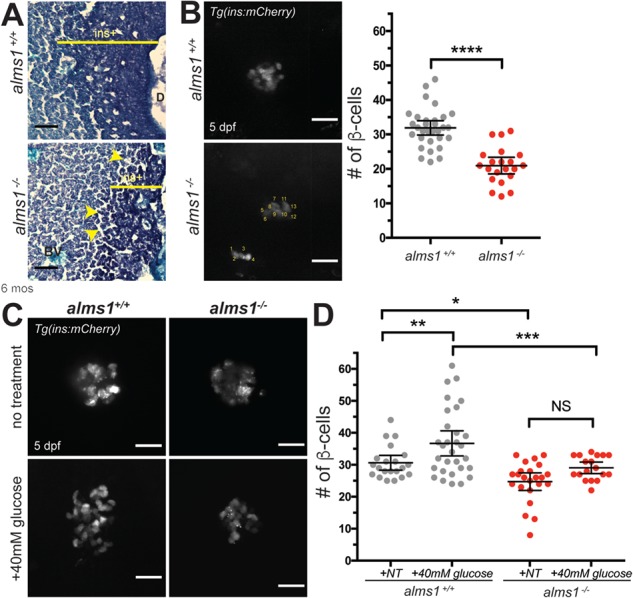
Figure 4.

alms1−/− zebrafish islets have fewer β-cells and reduced glucose responsiveness. (A) Aldehyde fuchsin staining of sectioned zebrafish at 6 months showing aberrant islet structure (`ins+', dark purple regions) and tissue degradation (arrowheads) in alms1−/− as compared to alms1+/+. BV, blood vessel; D, secretory duct. Scale bar, 50 μm. (B)β-cell imaging and quantification (count method in bottom panel) of 5 dpf larvae in alms1+/+ (n = 31) and alms1−/− (n = 22) larvae via ins:mCherry reporter expression. Scale bar, 25 μm. Dots, individual larvae. Statistics, Student's t-test with Welch's Correction. (C) Representative images of β-cells with and without exposure to 40 mm glucose in alms1+/+ and alms1−/− larvae. Scale bar, 25 μm. (D) Quantification of β-cells at 5 dpf from alms1+/+ (NT = 22, Glu = 31) and alms1−/− (NT = 25, Glu = 18) larvae via ins:mCherry reporter expression. Statistics, one-way ANOVA. Dots, individual larvae. Error bars, 95% CI. Where indicated, *P < 0.05, **P < 0.01, ***P < 0.001, ****P < 0.0001.
