Figure 5.

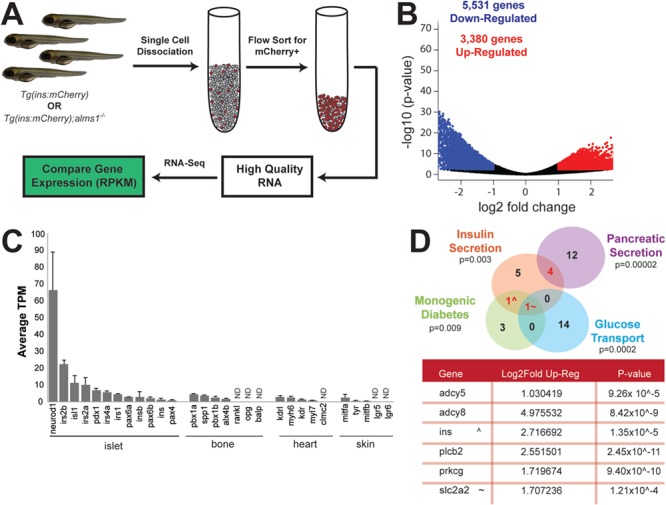
Transcriptomic analysis indicates dysregulation of insulin secretion and glucose sensing in zebrafish alms1−/−β-cells. (A) Schematic of experimental design for comparative gene expression in β-cell-enriched populations from age-matched control and alms1−/− larvae. (B) Volcano plot of significantly differentially expressed genes from GRZ10 between control and alms1−/− larvae. (C) Selected tissue specific genes identified in isolated alms1+/+ cells indicating high expression of pancreatic markers. Error bars, standard deviation. ND, not identified. (D) Subset of significantly up-regulated pathway nodes, identified by ConsensusPath DB, in alms1−/−β-cells. Genes within intersections are listed in table alongside the fold increase and significance compared to alms1+/+β-cells.
