Figure 6.

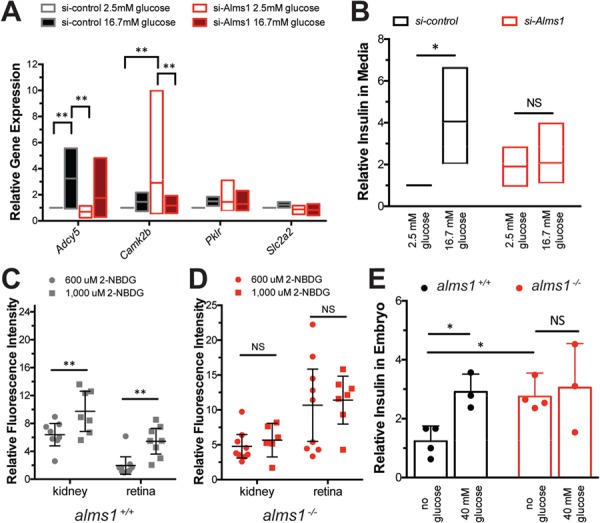
Hyperinsulinemia accompanied by defective glucose sensing with loss of Alms1. (A) Expression of glucose response genes in si-Alms1β-cells under basal (2.5 mm) and high-glucose (16.7 mm) conditions (n = 4). Cells were collected after 10 min after glucose stimulation. (B) Relative insulin by ELISA-based detection in culture media from β-cells after 30 min of exposure to 2.5 mm and 16.7 mm glucose (n = 3), normalized to basal si-control, shows failure of si-Alms1 cells to alter insulin secretion. (C and D) 2-NBDG at indicated concentrations was provided to (C) alms1+/+ and (D) alms1−/− larvae for 6 h. The kidney and retinal fluorescence intensity were quantified at each dose. Dots, individual larvae. (E) Relative insulin by ELISA-based detection under the indicated conditions in alms1+/+ (n = 30–50 per group) and alms1−/− (n = 30–50 per group) larvae at 5 dpf. All statistics, two-way ANOVA. Dots, replicates; error bars, 95% CI. Where indicated, *P < 0.05, **P < 0.01.
