Figure 3.

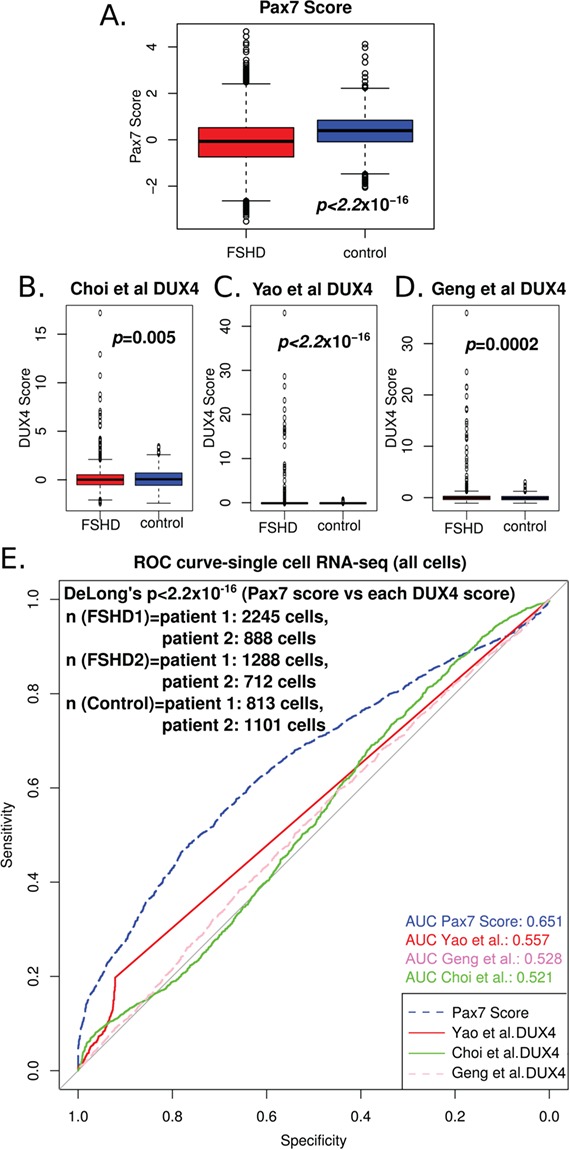
PAX7 target gene repression is a superior biomarker to DUX4 target gene expression in single-cell RNA-Seq of FSHD myocytes. (A) A box plot demonstrates that the PAX7 target gene signature derived from 311 up-regulated target genes and 290 down-regulated target genes in mouse validates as a biomarker in 7047 myocytes sequenced from two FSHD1, two FSHD2 and two control individuals, published by van den Heuvel et al. (2019) (32). The box represents the IQR, with the median indicated by a line. Whiskers denote min[1.5*IQR, max(observed value)]. ‘o’ represents data points >1.5 IQR from the median. The two-tailed Wilcoxon U-test P-value is given. (B–D) Box plots demonstrate that the 114 DUX4 target gene expression biomarker of Yao et al. (2014) (30), and two further DUX4 signatures that we derived previously (28) from studies by Geng et al. (2012) (24) and Choi et al. (2016) (34), each validate as biomarkers on the 7047 cells sequenced from two FSHD1, two FSHD2 and two control individuals, published by van den Heuvel et al. (2019) (32). Boxes represent the IQR, with the median indicated by a line. Whiskers denote min[1.5*IQR, max(observed value)]. ‘o’ represents data points >1.5 IQR from the median. (E) A ROC curve compares the discriminatory power of our PAX7 biomarker with the DUX4 target gene signatures of Yao et al. (2014) (30), Geng et al. (2012) (24) and Choi et al. (2016) (34), across the 7047 cells sequenced from two FSHD1, two FSHD2 and two control individuals, published by van den Heuvel et al. (2019) (32). DeLong’s test P-value (P < 2.2 × 10⁻¹⁶) demonstrates that the PAX7 biomarker (AUC = 0.651) is a significantly better discriminator of FSHD status than any of the three DUX4 biomarkers (AUC < 0.557).
