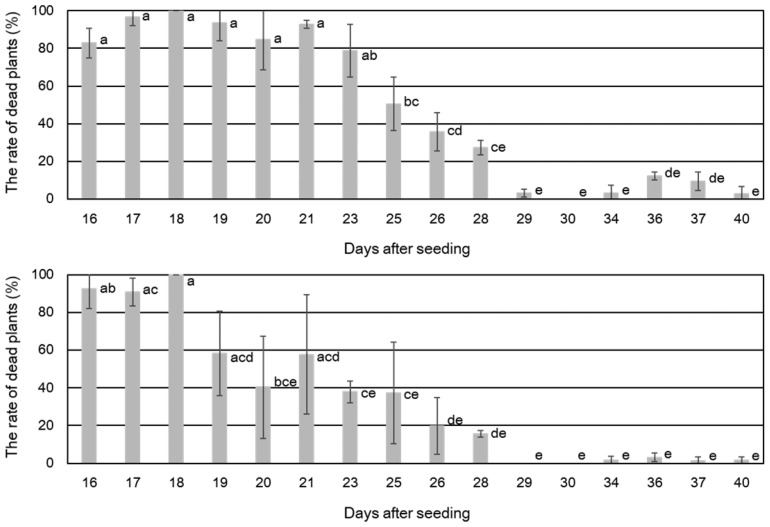
Fig. 2.
Temporal changes in the rates of dead soybean plants (%) following Phytophthora sojae inoculations of plants at different ages. Plants were inoculated with P. sojae isolate 13-B-RO-1 at 16–40 days after seeding. Mean values ± standard errors for three inoculated pots are plotted in two graphs (top: ‘Himeshirazu’; bottom: ‘Nattosyoryu’). Mean values with the same letters in each graph are not significantly different according to Tukey’s honestly significant difference test (p < 0.05).

