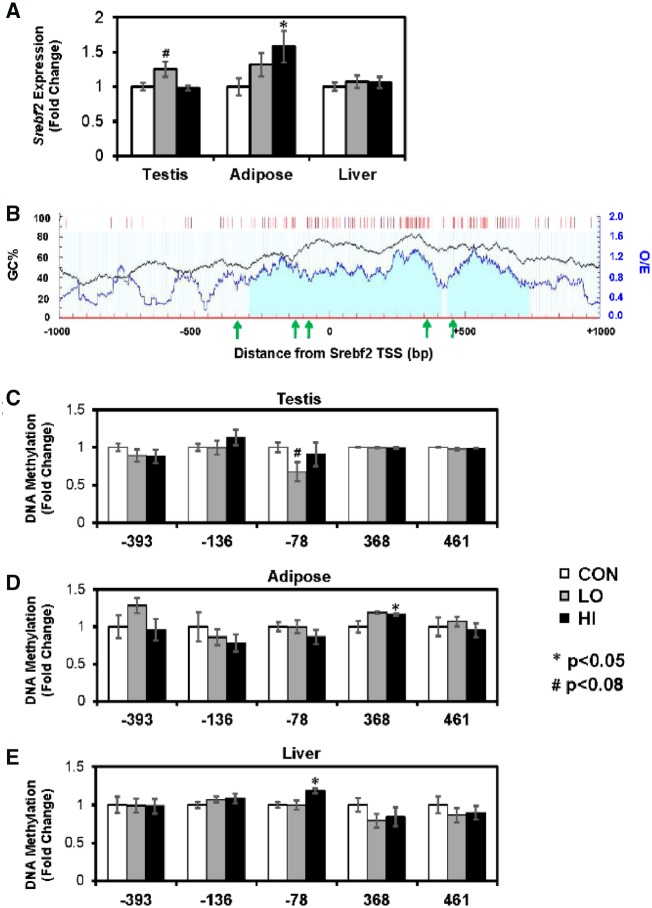
Figure 3:
(A) mRNA expression of Srebf2 across tissues. (B) CpG distribution around the Srebf2 transcription start site (TSS). Black line graph represents the guanine-cytosine content across the region (GC%). Blue line graph represents observed/expected CpG ratio (observed/expected). Red bars represent CpG sites. Light blue shaded area represents CpG island. Green arrows represent location of CpGs measured by MSP. Bottom three graphs show DNA methylation in (C) testis, (D) adipose, and (E) liver. Gene expression and DNA methylation values are represented as mean fold change compared to CON ± SEM. *P < 0.05, #P < 0.08

