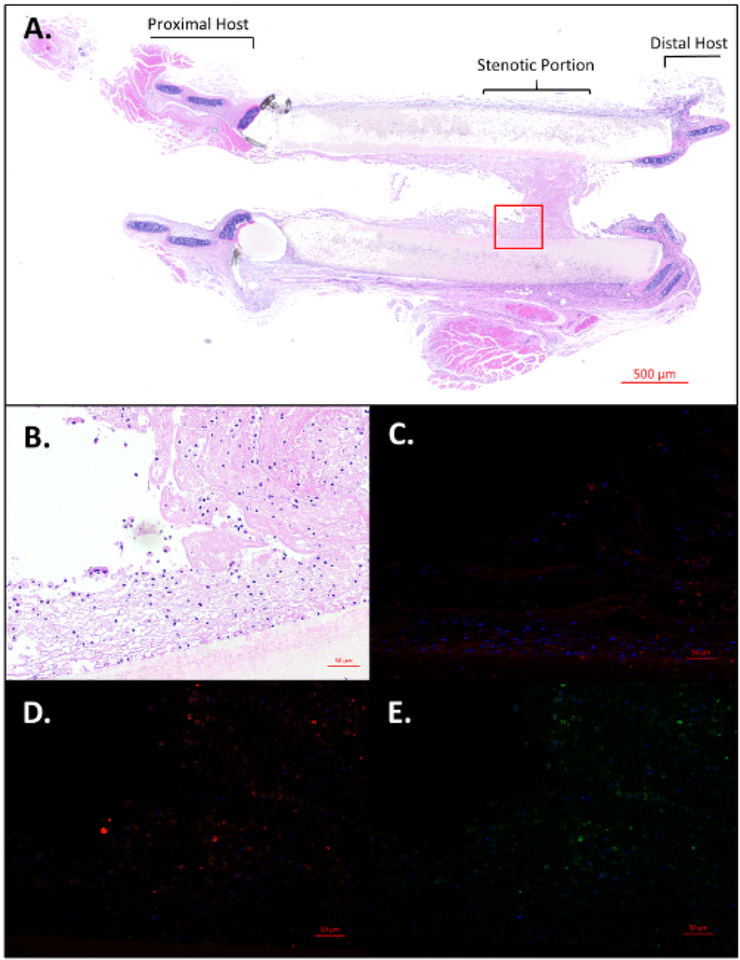
Figure 5: Histological visualization of stenotic region of graft.
(A) Longitudinally sectioned H&E of length of trachea including graft with distal stenosis near the anastomosis. Scale bar = 500 μm. High power images of selected stenotic region using H&E (B), F4/80 (C), Keratin 5(D), and Keratin 14 (E). Scale bars = 50 μm. Please click here to view a larger version of this figure.

