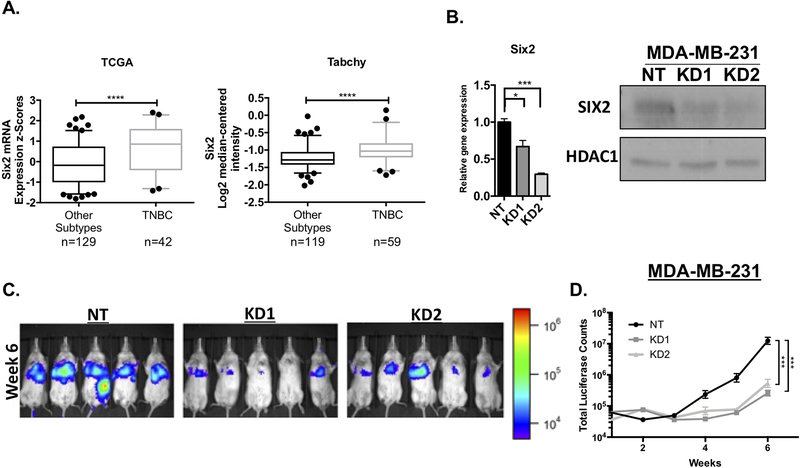
Figure 1: Six2 expression is enriched in triple-negative breast cancer (TNBC) where it promotes metastasis.
A) Six2 mRNA expression in TNBC vs all other subtypes. Expression levels of Six2 obtained from the TCGA Cell 2015 (cbioportal) (Gao et al. 2013; Cerami et al. 2012) and Tabchy breast datasets (Oncomine) (Rhodes et al. 2004) B) Levels of Six2 mRNA (left) and protein (right) in non-targeting (NT) Control MDA-MB-231 cells and in Six2 KD MDA-MB-231 cells. Gene expression was normalized to Ppib mRNA expression and fold-change is relative to the NT cells. P-values were calculated using one-way anova followed by Bonferroni multiple comparisons test of triplicate samples in a representative experiment (n=3). For western blot analysis, nuclear extracts are shown with HDAC1 used as a loading control. C) Luciferase-labeled MDA-MB-231 NT, KD1 and KD2 cells were injected into NSG mice through the tail vein. Metastatic burden was measured by IVIS imaging. Luciferase images are of mice at the week 6 timepoint (n=5 mice/condition). D) Quantification of average whole-body luciferase signal (total luciferase counts) for each condition over the duration of the animal experiment, (n=5 mice/condition). P-values to determine differences in luciferase signal over time were calculated using mixed model effects interaction analysis followed by Bonferroni correction.

