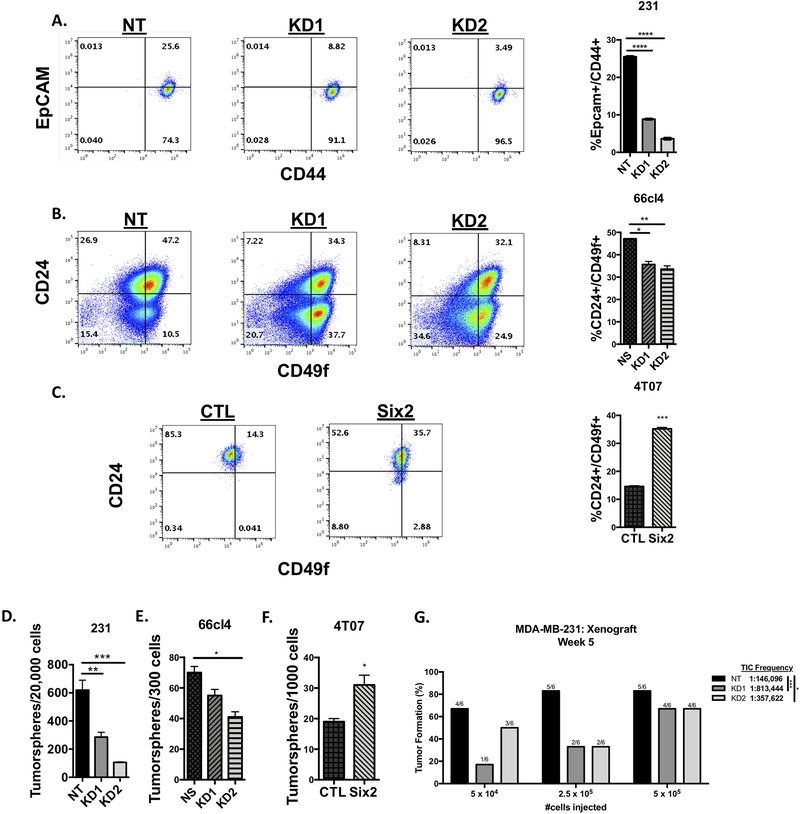
Figure 2: Six2 regulates stem cell-associated phenotypes in TNBC and mouse mammary carcinoma cells.
A) Six2 knockdown in MDA-MB-231 cells decreases the EpCam+/CD44+ population, as measured using flow cytometry. Quantification on the right is of triplicate samples for a representative experiment (n=3). Error bars represent the mean +/− SEM. P-values were calculated using one-way anova followed by a Bonferroni multiple comparisons test. B) six2 KD in 66cl4 cells decreases the CD24+/CD49f+ population, as measured using flow cytometry. Quantification and p-values were done as described above. C) Six2 overexpression in 4T07 cells increases the CD24+/CD49f+ population, as measured using flow cytometry. Quantification was performed as described above. P-values were calculated using an unpaired two-tailed t test. D) Six2 knockdown in MDA-MB-231 cells decreases tumorsphere formation when compared to control (NT) cells. Quantification on the right is of triplicate samples for a representative experiment (n=3). Error bars represent the mean +/− SEM. P-values were calculated using one-way anova followed by a Bonferroni multiple comparisons test. E) six2 knockdown in 66cl4 cells decreases tumorsphere formation when compared to control (NS) cells. Quantification and p-values were performed as described above. F) Six2 overexpression in 4T07 cells increases tumorsphere formation when compared to control cells. Quantification was performed as described above. P-values were calculated using an unpaired two-tailed t test. G) Six2 knockdown in MDA-MB-231 cells decreases tumor-initiating capacity compared to control (NT) cells. Cells were transplanted into the 4th mammary fat pad of nude mice at limiting dilutions. The graph displays the percentage of positive tumors at week 5 post tumor cell injection (n=6). Mean tumor-initiating cell (TIC) frequency was determined using the ELDA software program, with estimated ranges of TIC frequency being 72,956–292,560 for NT, 326,264–2,028,088 for KD1 and 175,059–730,575 for KD2.

