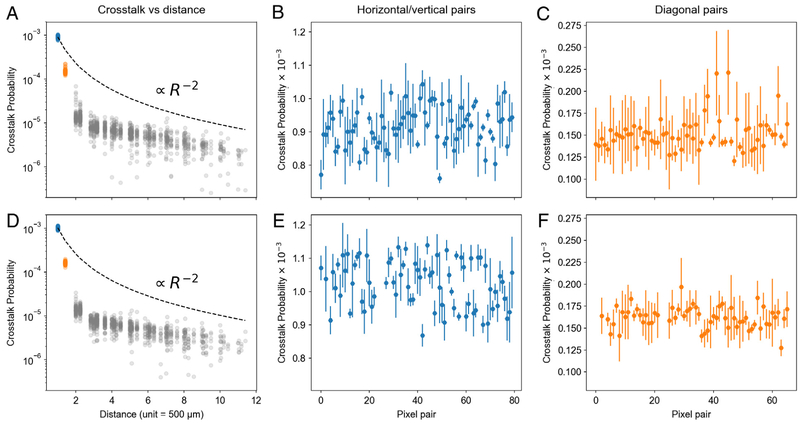
Fig. 1.
Optical crosstalk probability in the two 48-SPAD arrays used in our experiments. The two rows (A–C) and (D–F) present data from the “acceptor” and “donor” SPAD array respectively. Panels A, D show the crosstalk probability as a function of the distance between all pixel pairs. The black dashed line is a curve proportional to R−2 passing through the mean crosstalk of the nearest neighbor pairs (blue dots). The first two distances are color-coded and reported in detail in Panels B, E (nearest-neighbor pairs, 500 μm: blue) and Panel C, F (nearest diagonal neighbor pairs, 500 μm: orange). Error bars in Panels B, C, E, F indicate the ±3σ range, with σ computed according to Eq. (6). (For interpretation of the references to color in this figure legend, the reader is referred to the web version of this article.)

