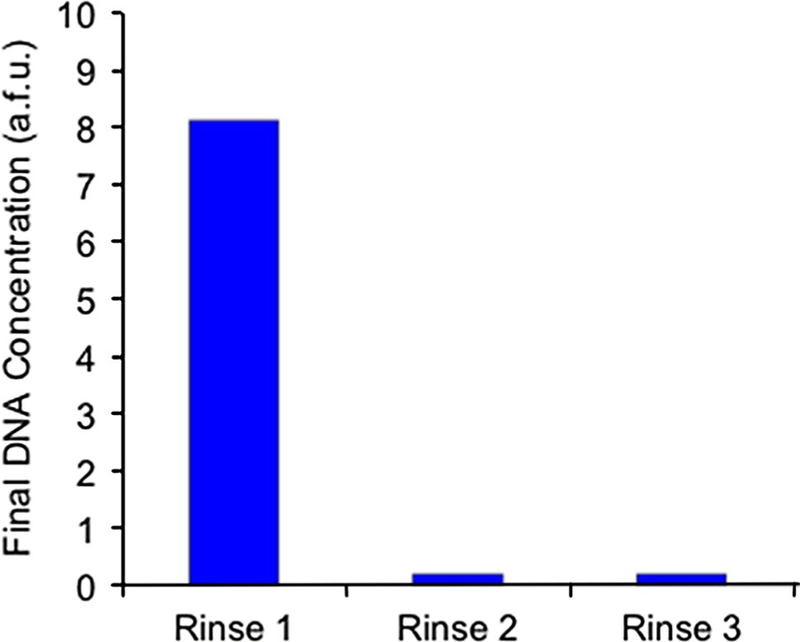
Fig. 7.

Fluorescent analysis of bead-based PCR amplification of candidate aptamers. Target-coated microbeads with strongly bound oligomers were washed multiple times, and the graph indicates the fluorescent intensity of microbeads following 25 cycles of PCR amplification of the eluent. The relative intensity of beads after each wash indicates that the starting DNA concentration was highest in the first eluted sample
