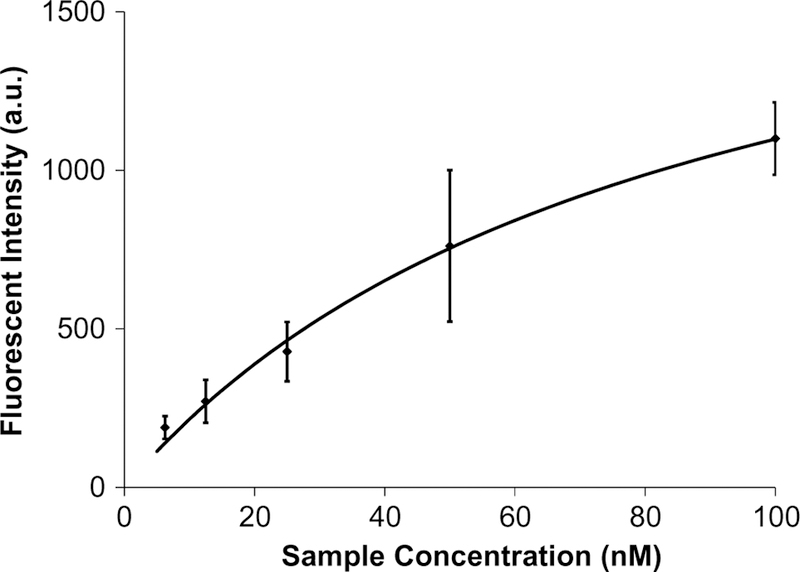
Fig. 9.

Analysis of IgE-aptamer candidate binding after two rounds of aptamer isolation. IgE-coated microbeads were exposed to fluorescently labeled aptamer candidates, and the fluorescence intensity of the beads was measured. This signal corresponded to the surface concentration of DNA and was used to estimate a KD of 83.9 nM
