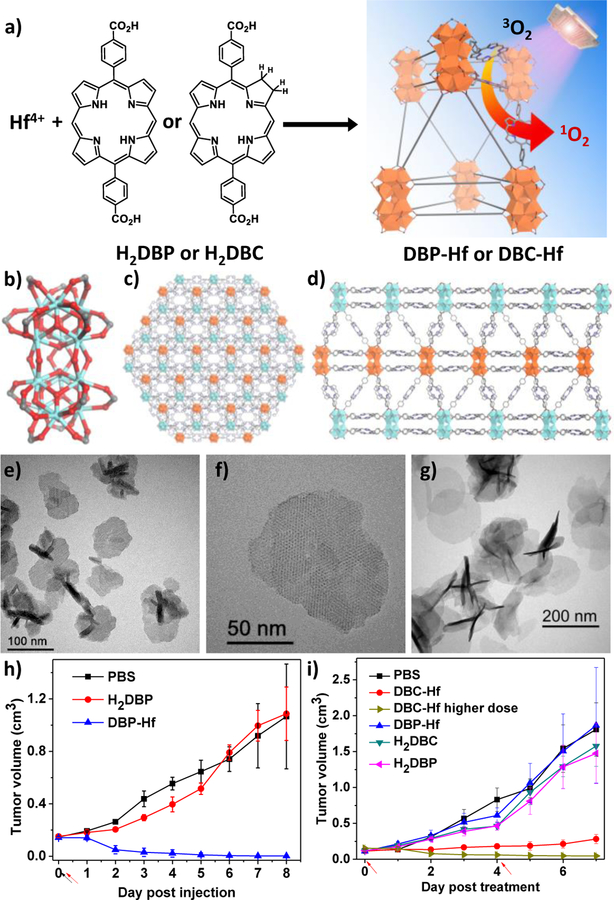
Figure 4.
(a) Schematic description of the synthesis of DBP-Hf or DBC-Hf and the singlet oxygen generation process. The structure of Hf12 SBU (b) and the idealized crystal structure of DBP-Hf viewed along the c axis (c) and the a axis (d). TEM (e) and high-resolution TEM (f) images of DBP-Hf showing nanoplate morphology. (g) TEM image of DBC-Hf. In vivo tumor regression after PDT treatment of DBP-Hf (h) and DBC-Hf (i) on different tumor-bearing mice models, along with the control groups. Black and red arrows refer to the time of injection and irradiation, respectively. Reproduced with permission.[108, 117] Copyright 2014 and 2015, American Chemical Society.

