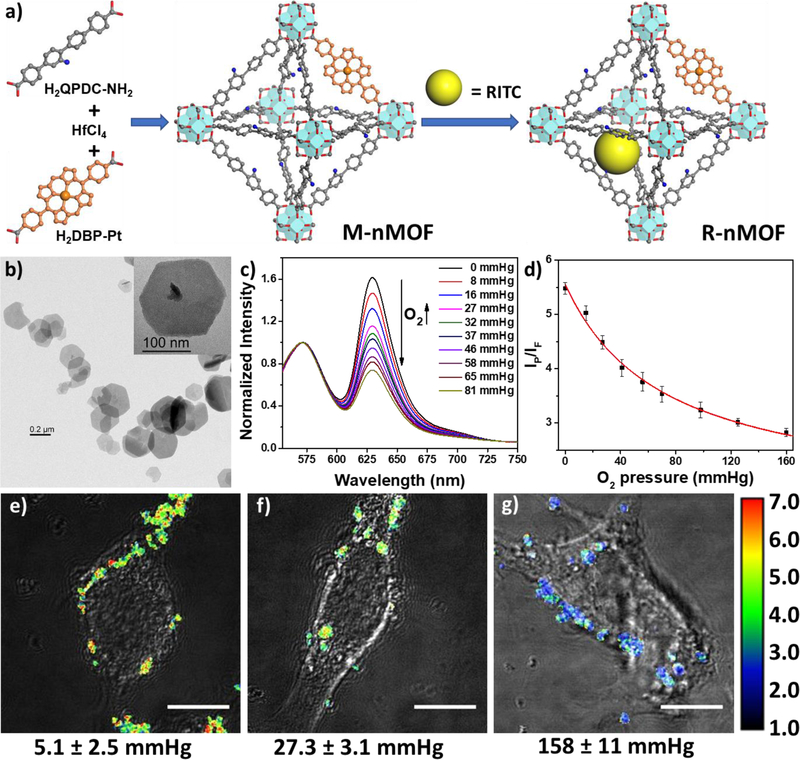
Figure 9.
(a) Scheme showing the nMOF synthesis and fluorophore attachment of R-nMOF. (b) TEM image of R-nMOF. (c) Emission spectra of R-nMOF in HBSS buffer under various oxygen partial pressures with excitation wavelength at 514 nm. (d) Calibration curve of the phosphorescence/fluorescence intensity of R-nMOF on CLSM under different oxygen partial pressures. Ratiometric luminescence imaging (λex=514 nm) of CT26 cells after incubation with R-nMOF under hypoxia (e), normoxia (f), and aerated (g) conditions. Scale bar: 10 μm. Reproduced with permission.[91] Copyright 2016, American Chemical Society.

