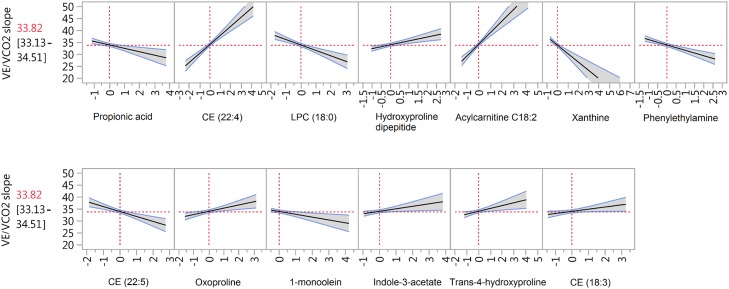
Fig 2. Prediction plot of VE/VCO2 shows the changes in expected VE/VCO2 slope value when the predictor’s levels change.
When there are higher values of CE (22:4), CE (18:3) Acylcarnitine C18:2, hydroxyproline dipeptide, oxoproline,trans-4-hydroxyproline, and indole-3-acetate, as well as lower values of CE (22:5), LPC (18:0), 1-monoolein, propionic acid, xanthine, and phenylethylamine, the CPET test predicts poor performance. CE = cholesterol ester, LPC = lysophosphatidylcholine.

