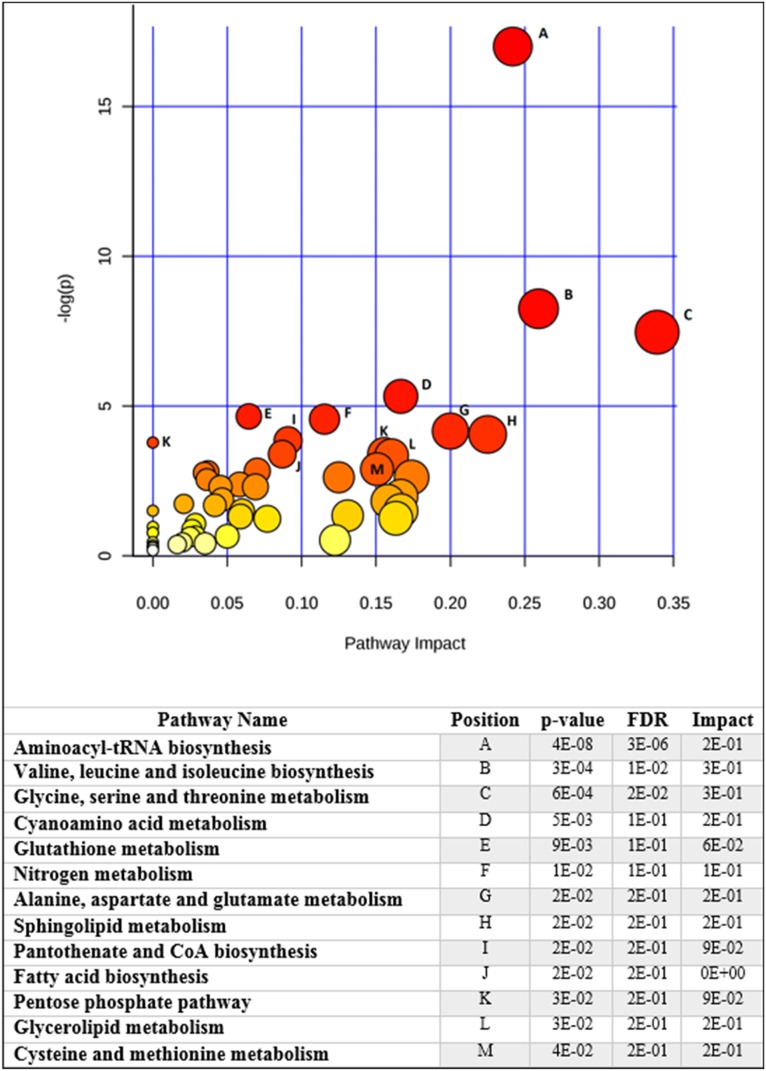
Fig 3. Metabolic pathway enrichment analysis shows the main pathways involved in heart failure test performance.
The plot shows matched pathways according to the p-values from the pathway enrichment analysis and pathway impact values from pathway topology analysis. The pathways with the lowest p-values and highest match status (predictors present in the pathways) are listed in the table along with their FDR correction and impact score.

