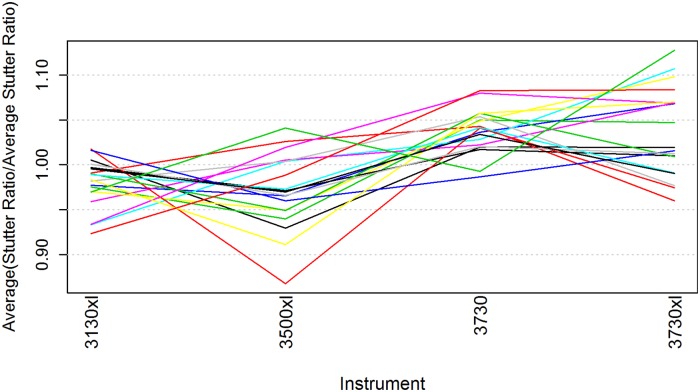
Fig 3. Summary of the effect of instrument on stutter ratio across markers.
The combination across the 19 STR markers and relative position for each of the instruments is condensed into a single plot. Each line corresponds to a particular marker, where the four points on each line denote the respective average normalized stutter ratios within that STR marker for the four instruments.

