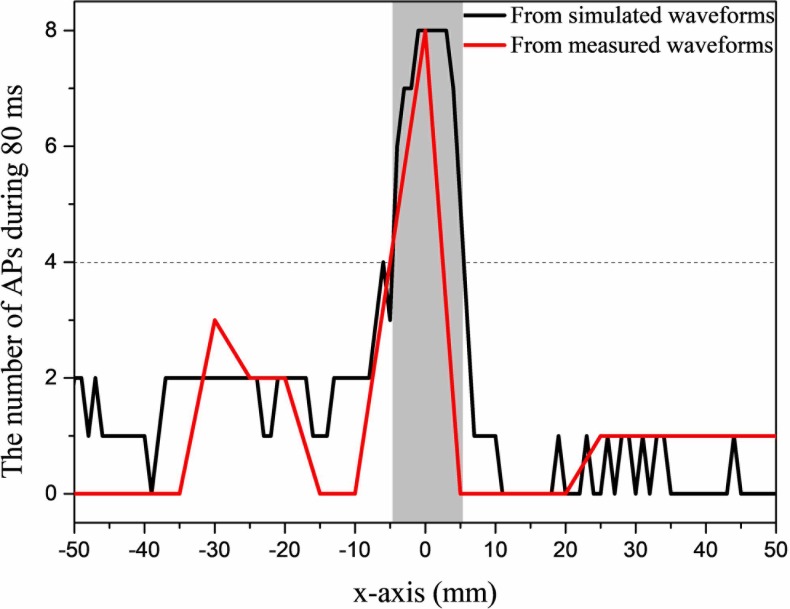
Fig 6. Change in the number of action potentials along x-axis when the target location was at the center of the brain.
Black: the number of action potentials obtained from simulated stimulus waveforms. Red: the number of action potentials simulated in NEURON based on recorded stimulus waveforms in saline solution. Grey rectangle represents the excitable region where the number of action potentials is above half maximum value (target region). The recorded time is a complete cycle of 80 ms.

