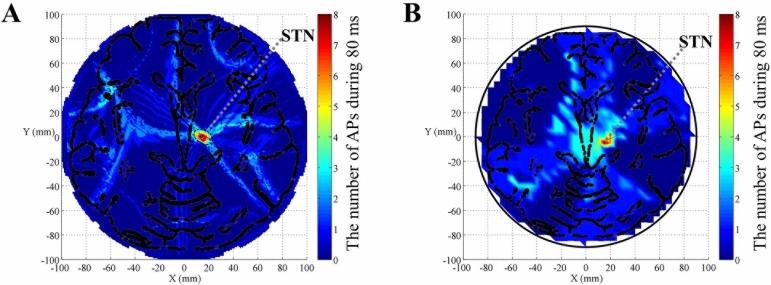
Fig 7. Neural excitability across the brain model when the target location was STN, based on MMS stimulation.
(A) The number of action potentials map obtained from simulated stimulus waveforms. (B) The number of action potentials map simulated in NEURON based on recorded stimulus waveforms in saline solution. All stimulus waveforms and membrane potential are recorded in a complete cycle of 80 ms. The arrangement of electrodes is shown in Fig 2B. The amplitude of each channel is illustrated in Table 3.

