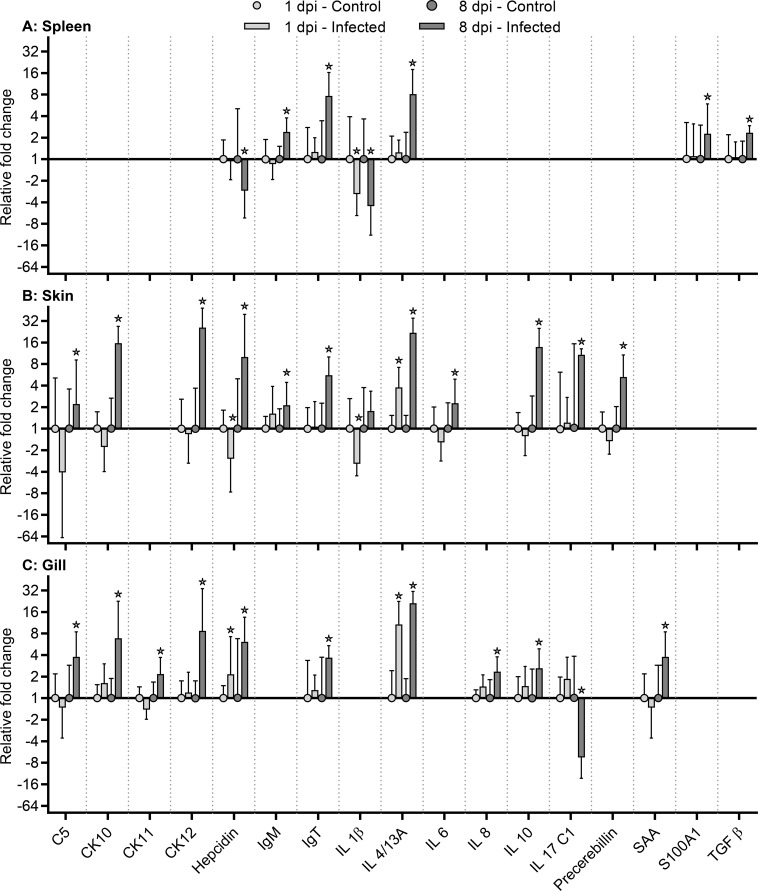
Fig 3. Gene expression analysis.
Relative fold change was calculated as 2-ΔΔCq. Due to their exponential nature, the geometric mean and geometric standard deviation were used. The EF1α was used as the reference gene (housekeeper). Only significant results are shown. A comprehensive summary of the gene expression study, including all the genes investigated, is present as supplementary material S3 Table. *: p<0.05 (Student’s t-test), fold change >2.

