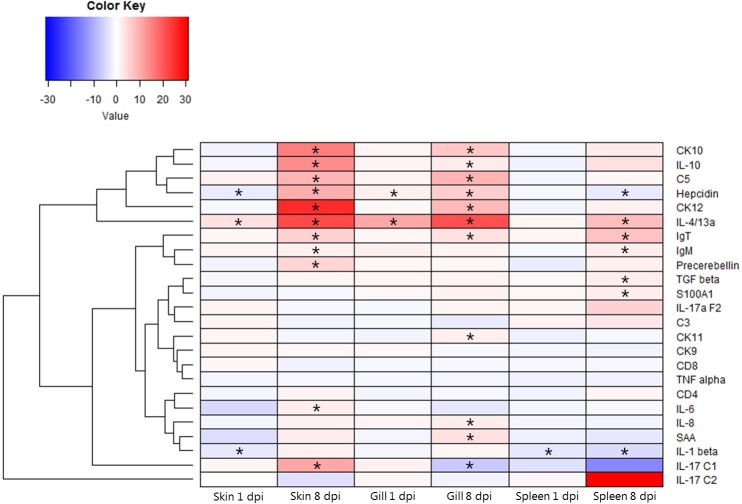
Fig 4. Heatmap showing the relative gene expression of immune associated genes in skin, gills, and spleen of rainbow trout, at different time points.
Infected fish compared to time point control fish. Red and blue indicate up-regulation and down-regulation, respectively. *: significant different from control group, p<0.05. The hierarchical clustering orders the rows based on similarity of expression levels (log2 fold change). The dendrogram indicates both similarity and the order that cluster are formed.

