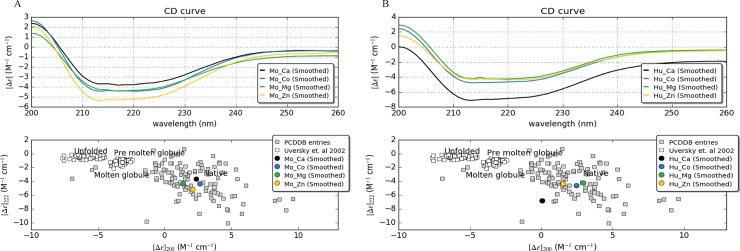
Fig 4. CD spectra of the MoSMP30 and HuSMP30.
CD spectrum ranges 200 nm to 260 nm was used and scanned the solution three times at room temperature. The representation of the spectrum is the average of the three scanned ODs which was reduced from the blank (buffer without protein). The spectrum is represented for A). MoSMP30 and, B) HuSMP30 with 10 mM of divalent cations Ca2+, Co2+, Mg2+ and Zn2+. Δε represents delta epsilon, a molar circular dichroism plotted with CAPITO software. Lower panel shows the folding states of both A) MoSMP30 and B) HuSMP30 proteins in the presence of different metals. CD values at λ = 200 nm versus values at λ = 222 nm were plotted to deduce the folding states.

