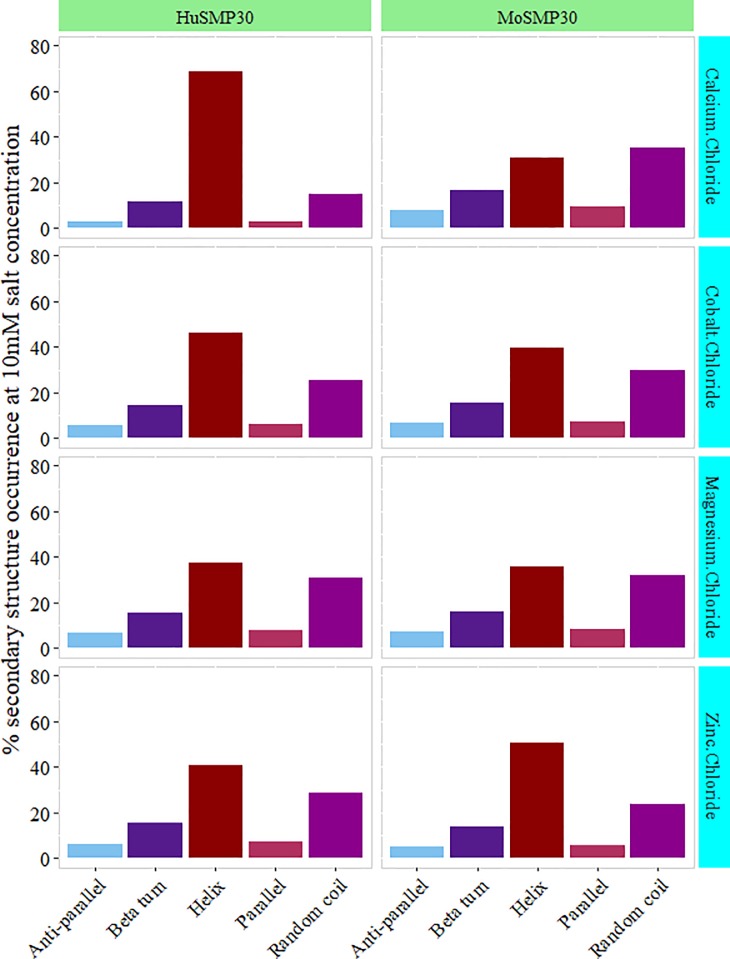
Fig 5. Variations in secondary structures.
Different divalent cations (i.e. Ca2+, Co2+, Mg2+ and Zn2+) with 10 mM concentration were used to generate the primary CD spectral data. Further, this data was processed in CDNN software to predict percent protein secondary structure conformation in a different state. CD spectra from 200 nm to 260 nm ranges were plotted in the graph. The plotted values are the result of blank (buffer without protein) subtraction and an average of triplicate samples.

