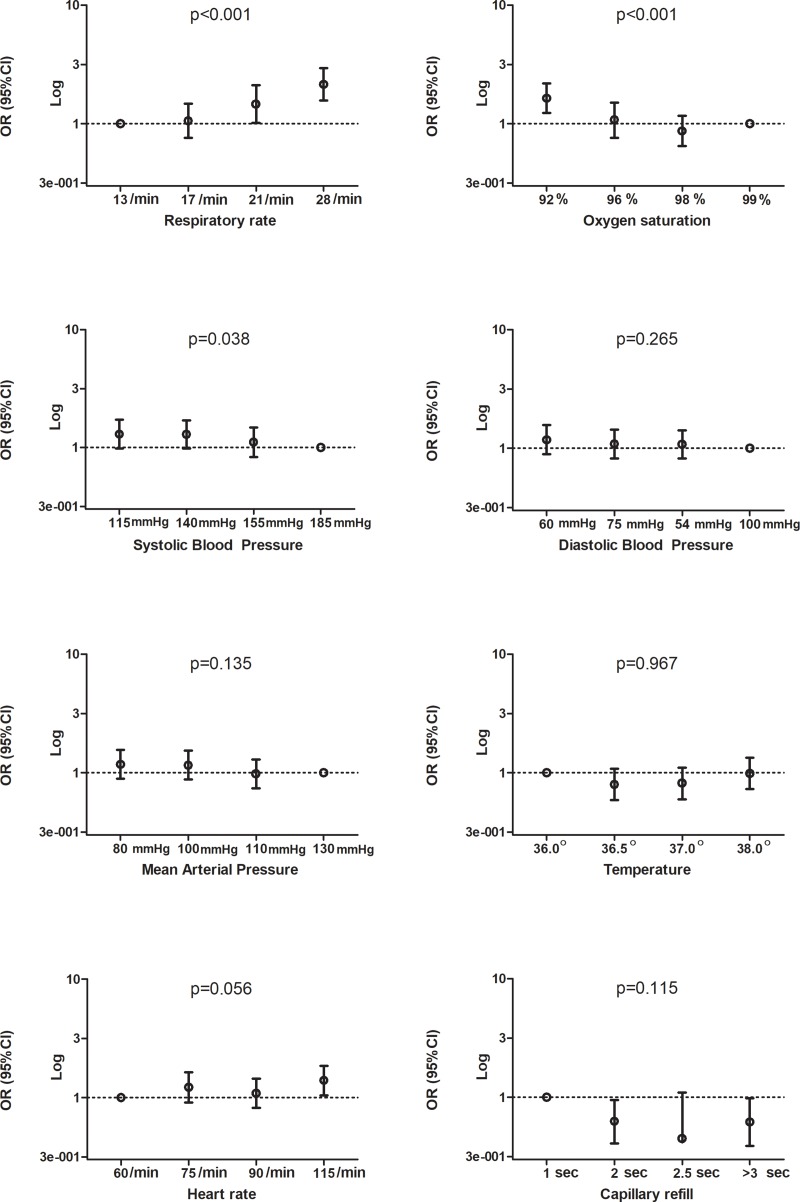
Fig 2. Quartiles of vital signs and their association with cognitive impairment.
Abbreviations:, mmHg = millimetres of mercury, min = minute, ⁰ = degrees celsius, sec: seconds, OR = odds ratio, 95%CI = 95% confidence interval, p = p-value, % = percentage. Y-axes is a logarithmic scale. The x-axes shows quartiles of the represented vital sign with the mean value within that category as label. The circle on the dotted line represents the reference category. Odds ratios and 95% CI’s can be found in S1 Table. Dot with bars represents the odds ratio with 95% confidence interval.

