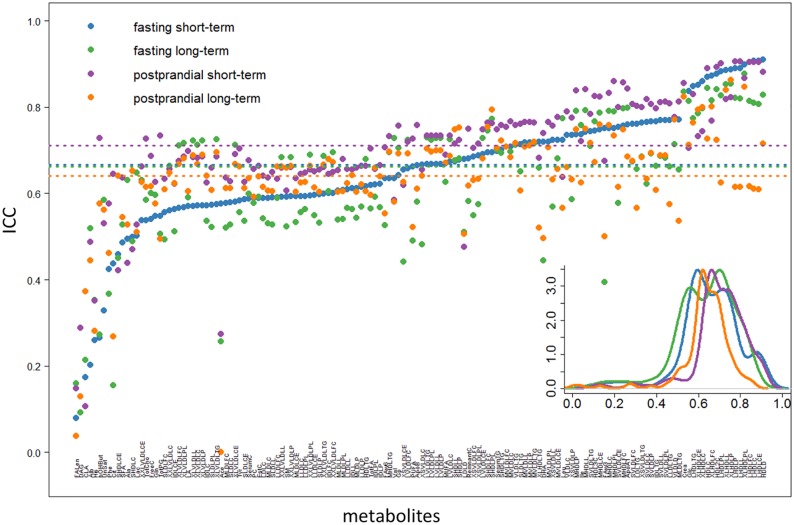
Fig 3. The ICC score distributions for biological reproducibility by comparisons between fasting/postprandial state, stratified on time interval between visits (short-/long-term).
Metabolites are ranked ascendingly by fasting short-term (blue dots). The lower corner contains a density plot of ICC score distributions from fasting short-term (blue), fasting long-term (green), postprandial short-term (purple) and postprandial long-term (orange) separately. The dash lines correspond to the median ICC scores among four scenarios.

