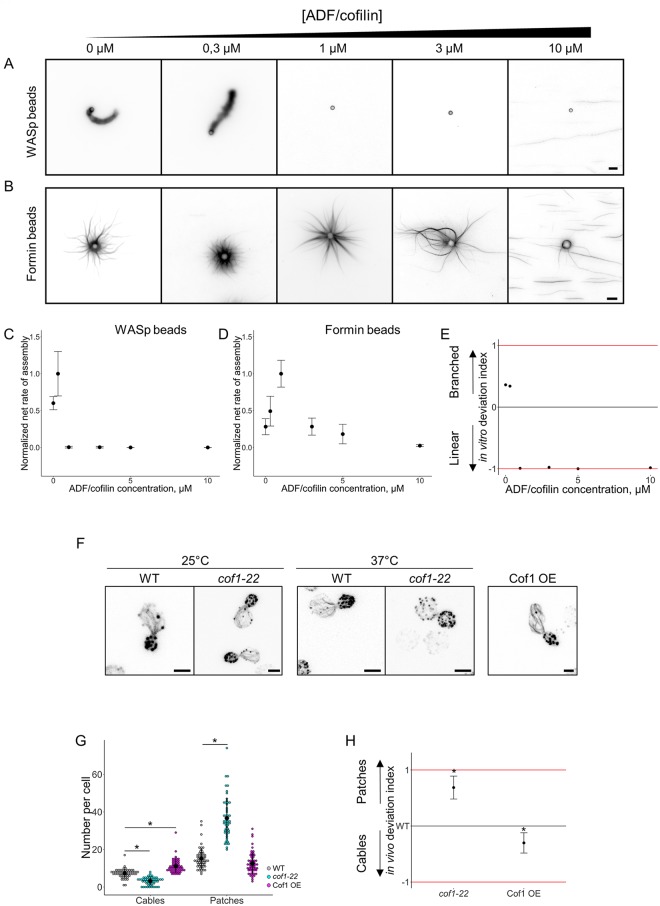
Fig 5. Modulation of the branched-to-linear actin network balance by ADF/cofilin.
The underlying data can be found within S1 Data. A. Fluorescence snapshots of actin networks assembled around WASp-coated microbeads in the presence of fluorescent actin, Arp2/3 complex, profilin, capping protein, and variable concentrations of ADF/cofilin. Images were taken 30 min after the initiation of the experiment. Scale bar: 5 μm. B. Fluorescence snapshots of actin networks assembled around formin-coated microbeads in the presence of fluorescent actin, Arp2/3 complex, profilin, capping protein, and variable concentrations of ADF/cofilin. Images were taken 30 min after the initiation of the experiment. Scale bar: 5 μm. C. Quantification of (A). Net rate of actin assembly around WASp-coated microbeads as a function of the ADF/cofilin concentration, normalized to the maximum value. D. Quantification of (B). Net rate of actin assembly around formin-coated microbeads as a function of the ADF/cofilin concentration, normalized to the maximum value. E. In vitro deviation index, calculated as a function of the ADF/cofilin concentration. F. Snapshots of the actin cytoskeleton organization of budding yeast cells fixed and labeled with fluorescent phalloidin for ADF/cofilin overexpressing cells (right image) and for cof1-22 cells at nonrestrictive (25 °C; left images) and restrictive (37 °C; center images) temperatures. Scale bars: 2 μm. G. Quantification of (F). Average number of actin patches and cables per cell in the wild-type, cof1-22 mutant, and ADF/cofilin overexpressing conditions. H. In vivo deviation index of ADF/cofilin overexpressing cells and cof1-22 cells at 37 °C. ADF, actin-depolymerizing factor; Arp2/3, actin-related protein 2/3; WASp, Wiskott–Aldrich syndrome protein.

