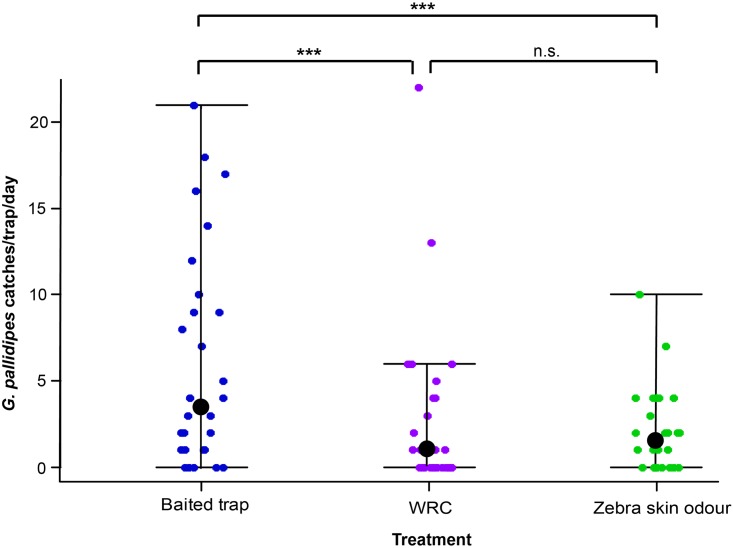
Fig 2. Daily catch of G. pallidipes in Ngu traps combined with crude zebra skin odor in 30 replicate trials.
Dot plots showing the daily trap catches of G. pallidipes. The boundaries of the dot plot whiskers represent the minimum and maximum of all the count data. Dots outside the boundaries are outliers and the black dots represent the median number of catches. Experiment was carried out in 3 x 3 Latin square designs. baited trap, positive control; WRC, negative control; *** = p < 0.001; n.s. = no significant difference.

