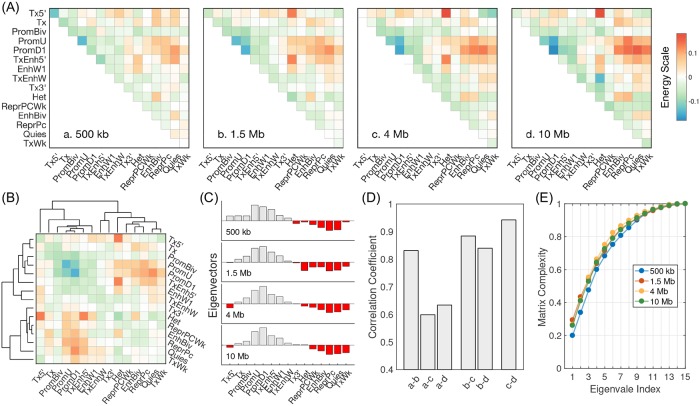
Fig 7. Dependence of chromatin state interaction energies on genomic separation.
(A) Heat maps for the interaction matrices at various genomic separations, with blue and red corresponding to attractive and repulsive interactions respectively. We subtracted out the mean of the interaction energies in order to shift different plots to the same scale. (B) Dendrogram calculated using the interaction energy matrix at 1.5 Mb to highlight the hierarchical clustering of chromatin states. The coloring scheme is the same as in part (A). (C) The eigenvectors corresponding to the largest eigenvalues of the four interaction matrices, with grey and red indicating positive and negative values respectively. (D) Pearson correlation coefficients between interaction matrices at different scales. (E) The complexity measure for different interaction matrices as a function of the index for top eigenvalues. See text for the definition of the complexity measure.

