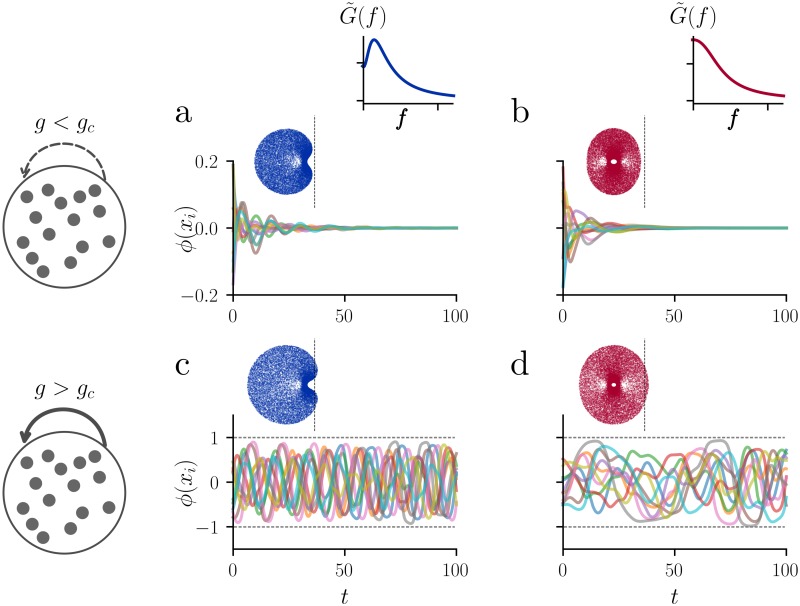
Fig 1. Microscopic network dynamics with firing rate adaptation.
In the top row (panels a and b), the network is below the bifurcation, (g = 0.96gc(γ, β)), and it exhibits a transient activity to the stable fixed point. In the bottom row (panels c and d), the fixed point is unstable (g = 1.3gc) and the network exhibits irregular, self-sustained oscillations. In the left column (panels a and c), the network is in the resonant regime (γ = 0.2, β = 0.5), as it can be seen from the single-neuron linear frequency response function (cf. Eq 9). In the right column (panels b and d), the network is in the non-resonant regime (γ = 1, β = 0.1). For each panel, ten randomly chosen units are shown, out of N = 1000 units. Panel c corresponds to the resonant chaotic state, while in panel d the system exhibits chaotic activity similar to the case described in [1]. The insets show the eigenvalue spectrum in the complex plane for the four different sets of parameters. The dashed black line indicates the imaginary axis. Comparing the eigenvalue spectrum of panel a with the one of panel c, we see that the network undergoes a Hopf bifurcation.

