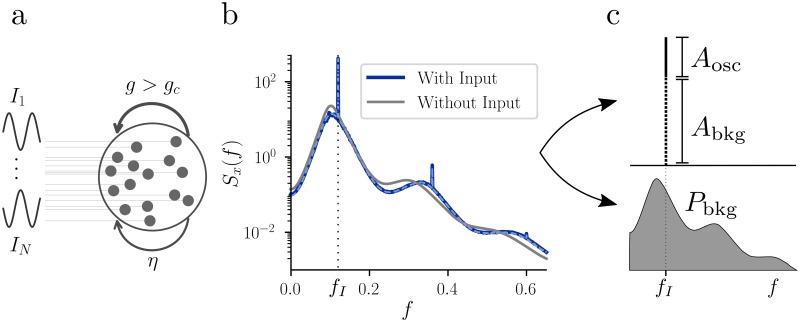
Fig 4. Response of the mean-field network to an oscillatory input.
a: Schematic representation of the random network driven by an external input, with phase randomization. For g > gc, the chaotic activity can be seen as internally-generated noise. b: Effect of an oscillatory external input on the power spectral density Sx(f). In the example, γ = 0.25, β = 1, g = 2gc(γ, β), fI = 0.12, while AI = 0.5 (blue) and AI = 0 (gray). Simulations (solid blue) and theory (dashed blue) are superimposed. c: Top: Schematic representation of the separation of the power spectral density into its oscillatory (Aosc) and chaotic (Abkg) components. Note that these quantities depend on the size of the frequency discretization bin. Bottom: Graphical interpretation of Pbkg, i.e. the total variance of the network activity due to chaotic activity (shaded gray area).

