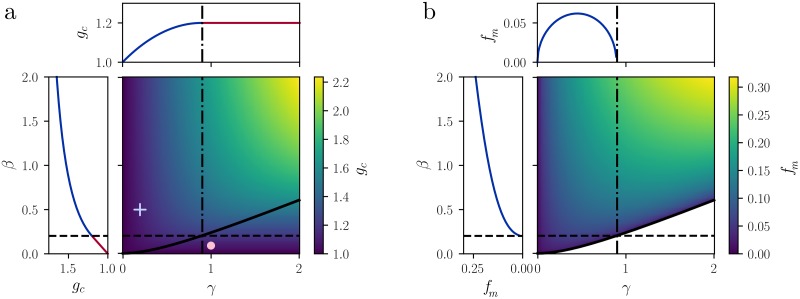
Fig 7. Stability of the fixed point and local properties.
a: Critical value of the coupling gc (color code, right) for different adaptation parameters γ (horizontal axis) and β (vertical axis). The curve βH(γ) (solid black line) separates the regions of the γ − β plane in which for increasing g we encounter a Hopf bifurcation (above βH(γ)) or a saddle-node bifurcation (below βH(γ)). Cross and filled circle: parameters used in Fig 1. Left inset: dependence of gc on β for fixed γ = 0.9. Top inset: dependence of gc on γ for fixed β = βH(γ = 0.9). Blue line: Hopf bifurcation; red line: saddle-node bifurcation. b: Resonance frequency fm for different adaptation parameters γ, β. Notice that in the non-resonant region the resonance frequency is not defined. Left inset: square-root increase of fm as a function of β for fixed γ = 0.9. Top inset: non-monotonic behavior of fm as a function of γ, for fixed β = βH(γ = 0.9).

