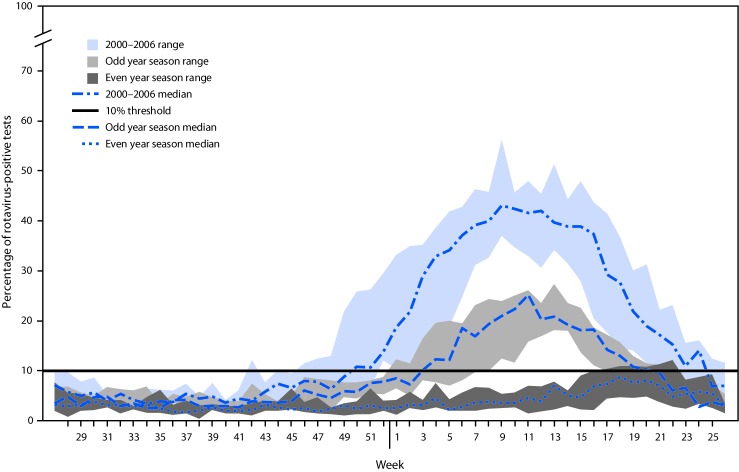
FIGURE 2.
Rotavirus season duration and peak activity for prevaccine (2000–2006) and postvaccine years (2008–2018), stratified by even/odd year season,* by week of season — National Respiratory and Enteric Virus Surveillance System, United States 2000–2018
* Odd year seasons: 2008–09; 2010–11; 2012–13; 2014–15; 2016–17. Even year seasons: 2009–10; 2011–12; 2013–14; 2015–16; 2017–18.

