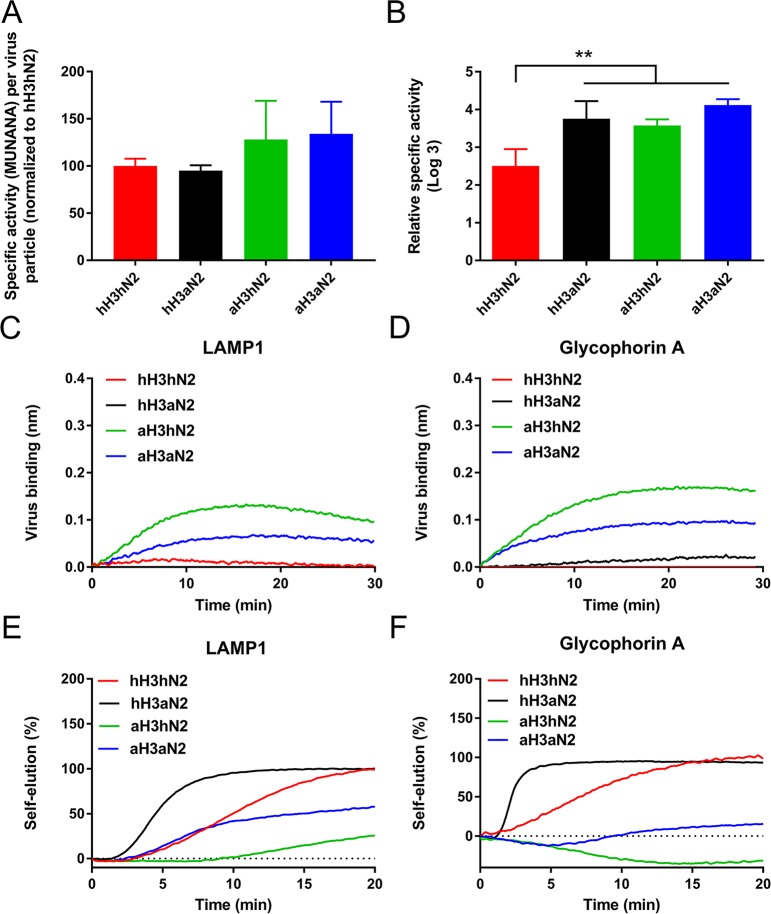
Fig 5. NA enzymatic activity in virus particles.
(A) Numbers of particles in virus preparations were determined using Nanoparticle Tracking Analysis (Nanosight NS300); the NA activity in these preparations was analysed by MUNANA assay. Relative NA activity per virion is graphed (N = 3). (B) Virus preparations were normalized based on their MUNANA activity. Fetuin-coated plates were incubated with serial dilutions of viruses in the absence of OC. Cleavage of SIAs from glycoproteins was monitored using ECA, which binds desialylated glycans. Dilutions corresponding to half-maximum lectin binding were determined by non-linear regression analysis and used to calculate the specific activity of the different viruses. See S9 Fig for curves. Mean values of two independent experiments performed in duplicate are shown. Standard deviations are indicated. Stars depict P values calculated using one-way ANOVA (**, P<0.01). (C and D) Identical number of hH3hN2 and hH3aN2, and aH3hN2 and aH3aN2 virus particles were analysed for their ability to bind LAMP1 (C) or glycophorin A (D) in the absence of OC using BLI. (E and F) After binding of virus preparations with identical particle numbers to LAMP1 (E) or glycophorin A (F) in the presence of OC (similarly as shown in Fig 4), OC was removed by three repeated washes and virion self-elution in the absence of OC was monitored. Dissociation of virus particles was normalized to the virus association levels in the presence of OC. Experiments were performed three times. Representative experiments are shown.

