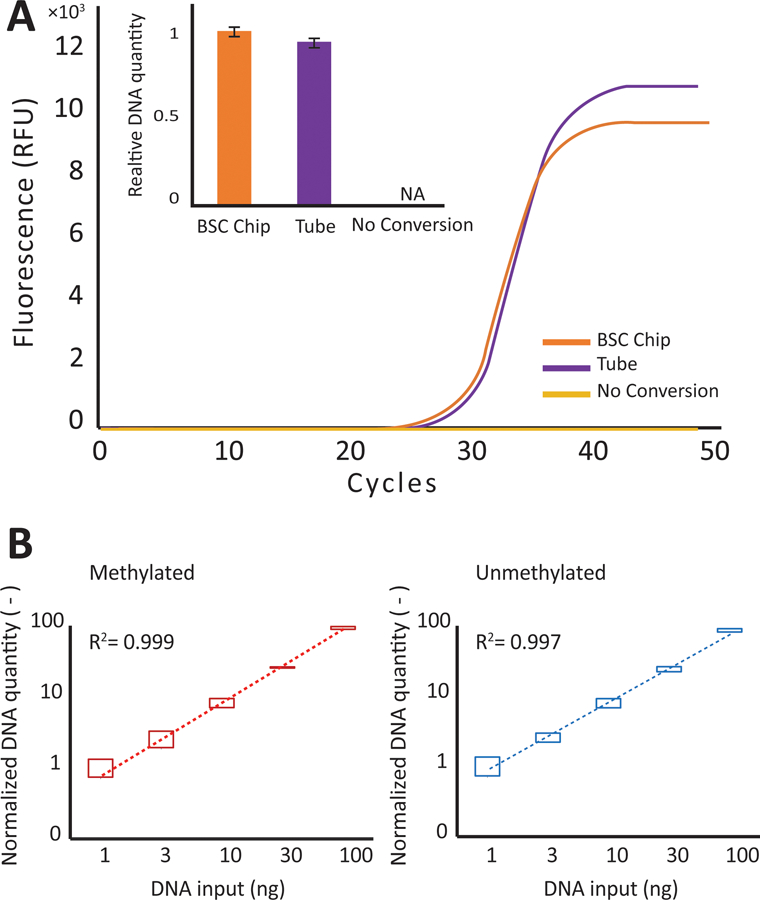
Fig. 5.

Comparison between chip and tube performance. A) The qPCR amplification curve for the tube process (shown in blue) is compared to the chip process (shown in red). B) The calculated DNA recovery (based on CT value and normalized to 1 ng) for varying quantities of DNA are compared across methylated and unmethylated sequences. The top and bottom bars reflect the variability across multiple devices and different channels
