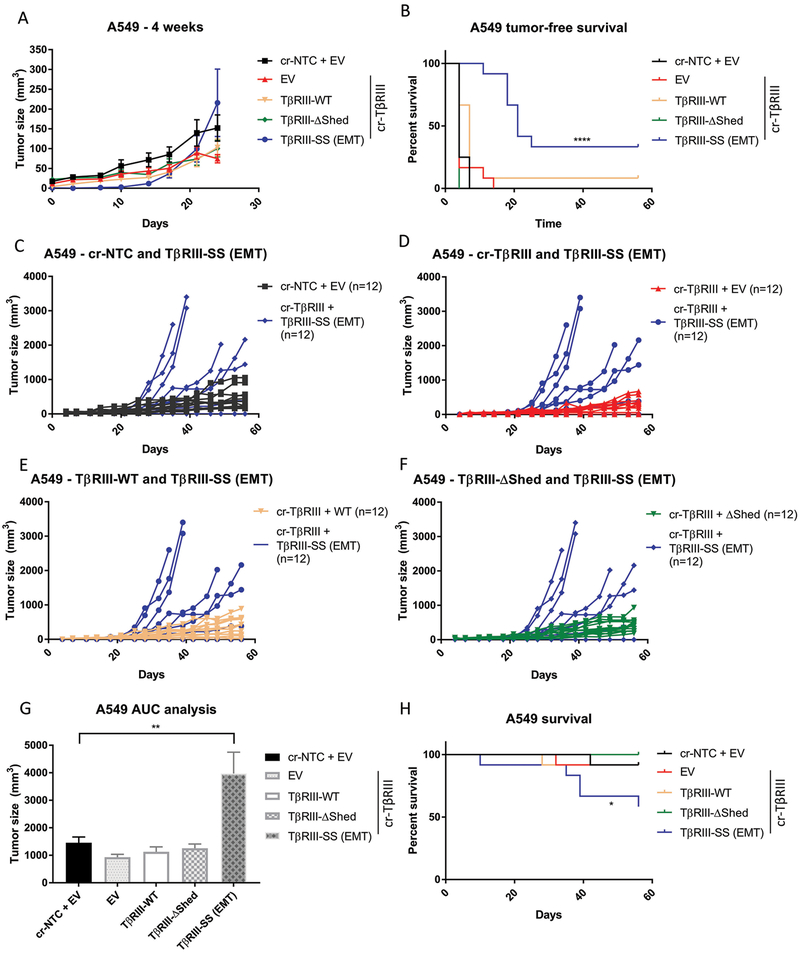
Figure 6:
TβRIII-SS (EMT) decreases in vivo tumorigenicity but increases tumor growth rate. (A) A549 cells were subcutaneously injected in athymic mice and tumor growth was assessed via caliper measurement twice a week. Mean tumor volume was quantified. 4-week timepoint highlights differences in early tumor growth. (B) Mice were palpated twice a week for tumors and tumor-free was survival plotted. (C, D, E, F) Tumor size of individual mice over time comparing TβRIII-SS (EMT)-injected mice with other groups. (G) Area under the curve calculation to assess tumor growth rate tumors. Mice without tumors were excluded. (H) Mice were sacrificed when tumors reached 2000mm3 or reached humane endpoints, and survival was plotted. n = 12 for each cohort of mice. * p< 0.05, ** p < 0.01, **** p < 0.0001. Error bars are ±S.E.M.

