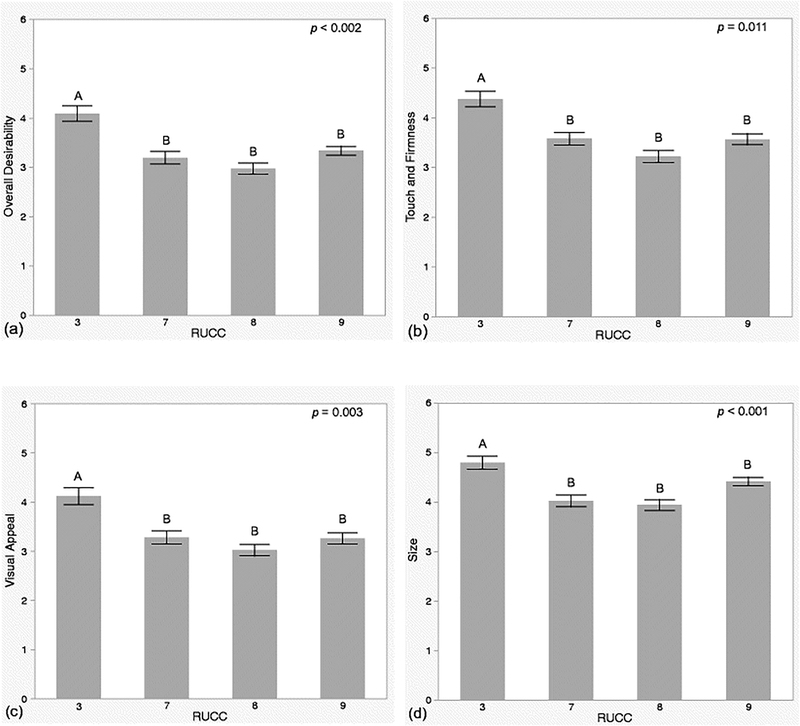
Figure 3.
ProDes Scores for Individual Observational Measures by Rural to Urban Continuum Code. Analysis of Variance found significant differences in means of ProDes Scores for four of the five individual observational measures of the 7-point Total ProDes Tool (on a scale 0 to 6) on the basis of rurality as determined by the USDA Rural Urban Continuum Code (RUCC) including for (a) overall desirability, (b) touch and firmness, (c) visual appeal, and (d) size. RUCC ranges from 1 through 3 are classified as metro (urban) and 4 through 10 are classified as non-metro (rural). RUCC levels not connected by the same letters in the graph have significantly different means while RUCC levels that have different letters above the bar in the graph are statistically different. Each bar is constructed using one standard error from the mean.

