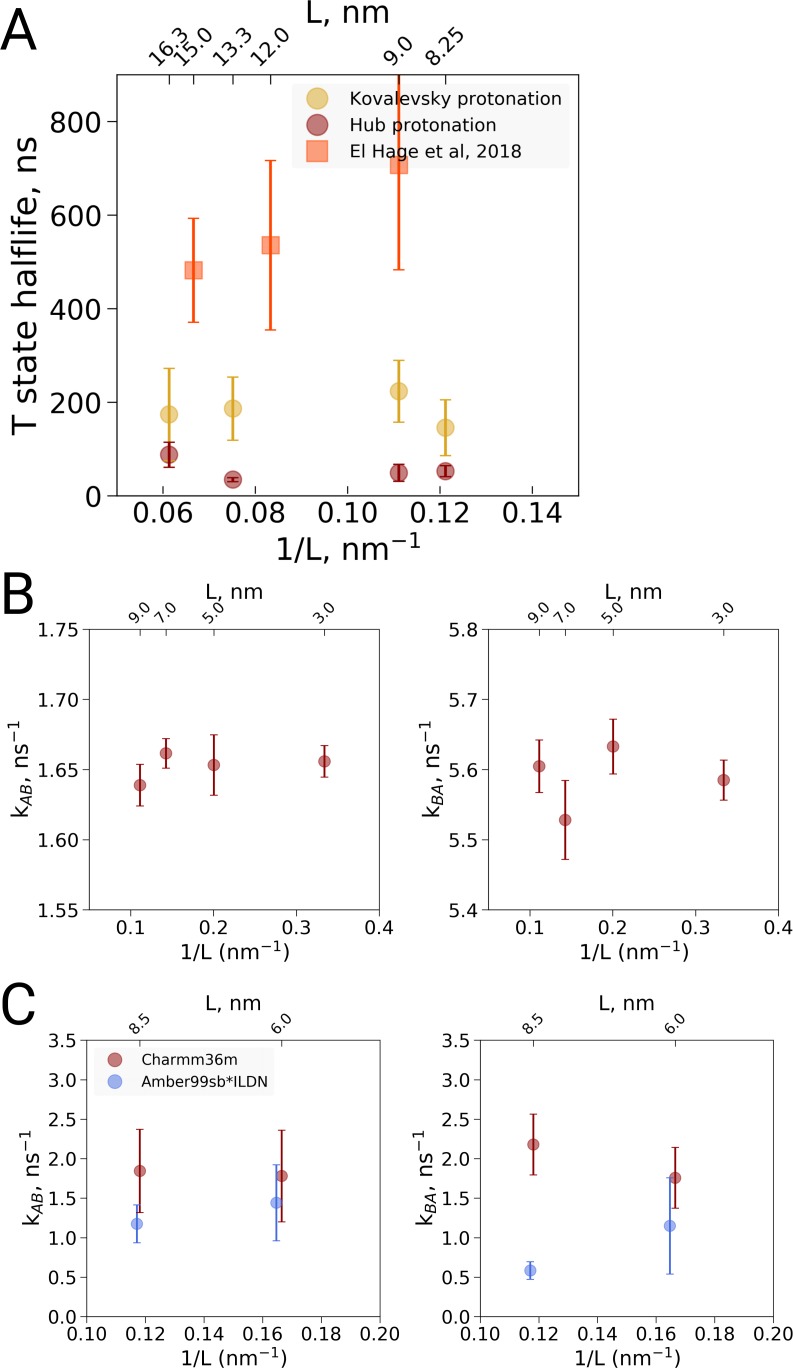
Figure 3. Kinetic analysis of hemoglobin, ubiquitin and alanine dipeptide.
(A) Hemoglobin: average transition time from T to R, expressed as the time in which half of the replicas displayed the T to R transition, as a function of the simulation box size. Three different system setups were used for simulations. The Kovalevsky and Hub setups differ in the protonation of hemoglobin (Vesper and de Groot, 2013), both model the iron-proximal histidine interaction as a covalent bond. The El Hage setup is obtained from El Hage et al and thus identical to the one used in El Hage et al. (2018), where the iron-histidine were not covalently bound. Note that the difference in size of the error bars is explained by the difference in transition times: larger transition times are accompanied by larger absolute uncertainties. (B) Transition rates between the two minima in ubiquitin: rates from A to B (left) and from B to A (right). The reaction coordinate with the minima is depicted in Figure 4E,F. (C) Transition rates between the two minima in alanine dipeptide: rates from A to B (left) and from B to A (right). The reaction coordinate with the minima is depicted in Figure 4B,C.

