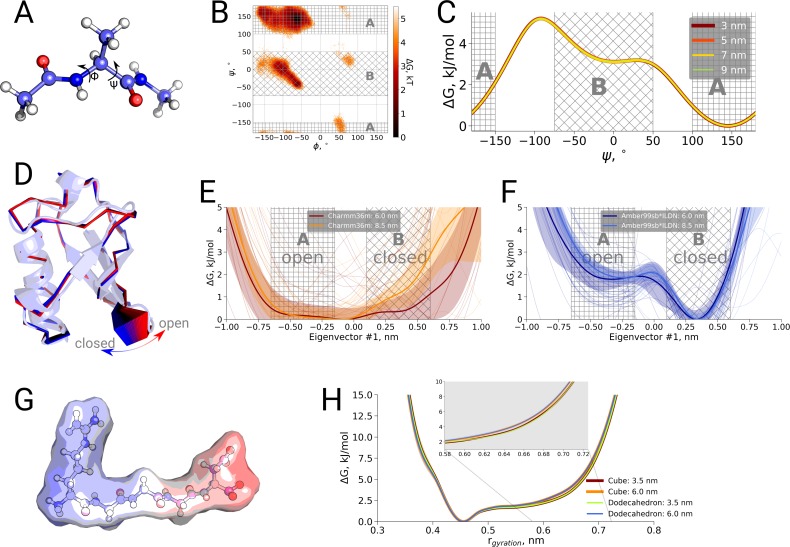
Figure 4. Thermodynamic analysis of hemoglobin, ubiquitin and RGGGD peptide.
(A) Structure of the alanine dipeptide. (B) Free energy surface for alanine dipeptide simulated in the smallest box projected onto the backbone dihedrals marked in the panel (A). (C) Free energy profile along the dihedral angle. (D) Structure of ubiquitin and an interpolation of the motion along the principal component with the largest variance (pincer mode). (E) Free energy profile projected on the pincer mode for ensembles generated with the Charmm36m force field. (F) Free energy profile for the Amber99sb*ILDN force field. (G) Structure of the RGGGD pentapeptide with the surface color corresponding to the surface charge: blue - positive, red - negative. (H) Free energy profiles for the pentapeptide projections as a function of the radius of gyration.

