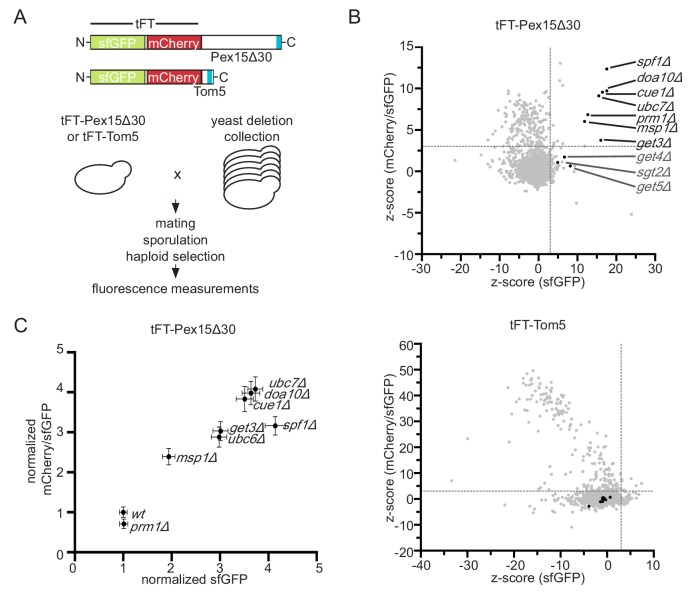
Figure 1. Genome-wide screen to identify factors stabilizing Pex15Δ30 TA protein.
(A) Overview of the tFT-Pex15Δ30 and tFT-Tom5 TA protein reporters. Tail-anchor is highlighted in blue. Strains, expressing either tFT-Pex15Δ30 or tFT-Tom5 from the TEF1 promoter were crossed into the yeast non-essential gene deletion collection (Winzeler et al., 1999) using automated mating and selection procedure. sfGFP and mCherry fluorescence was acquired from arrayed colonies grown on agar (n = 4). (B) sfGFP signal and mCherry/sfGFP ratio of the tFT-Pex15Δ30 and tFT-Tom5 reporters of each mutant shown as z-score (which resembles the standard deviations from the mean a data point is). Mutants with z-scores > 3 for sfGFP and mCherry/sfGFP ratio (at 5% false discovery rate) for Pex15Δ30 and not affecting Tom5 are highlighted in black. Dashed gray lines indicate the thresholds. GET mutants below the threshold are highlighted in dark gray. (C) Flow cytometry validation of generated yeast mutants as indicated. Mean sfGFP intensities and mCherry/sfGFP ratios normalized to wt (n = 4, ± SEM).


