(
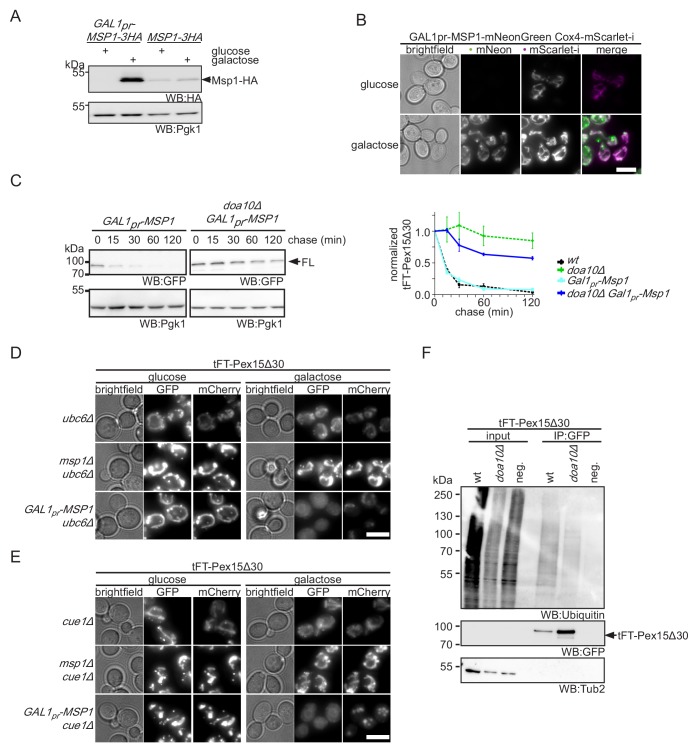
A) Lysate of yeast strains expressing 3HA-tagged Msp1 from endogenous (
MSP1-3HA) and
GAL1-inducible promoter (
GAL1pr-MSP1-3HA) cultured in Msp1 expression restrictive (glucose) and permissive (galactose) conditions. Expression of Msp1-3HA was induced for 4 hr. Pgk1 is used as loading control. (
B) Localization of Msp1-mNeonGreen under the control of
GAL1 promoter. Msp1 expression was induced for 4 hr prior imaging. Mitochondrial structures are visualized by Cox4-mScarlet-i expression, magenta. Colocalization of Msp1 and Cox4 is highlighted in white in merge. Scale bar: 5 μm. (
C) Cycloheximide chase of tFT-Pex15Δ30 expressing wt and
doa10Δ strains overexpressing Msp1 from the
GAL1-inducible promoter cultured in culture medium supplemented with galactose and quantification (n = 3, ± SEM). For comparison of tFT-Pex15Δ30 level with endogenous Msp1 expression and
doa10Δ quantification from cycloheximide chases of
Figure 3—figure supplement 1C is projected with dashed lines. (
D) Microscopy analysis of
CUE1 deficient strains expressing tFT-Pex15Δ30 in yeast in combination with
msp1Δ and Msp1 overexpression for 4 hr (
GAL1pr-MSP1). Scale bar: 5 μm. (
E) Microscopy analysis of
UBC6 deficient strains expressing tFT-Pex15Δ30 in combination with
Δmsp1 and Msp1 overexpression for 4 hr similar as in (
D). (
F) Immunoprecipitation of tFT-Pex15Δ30 from indicated strains. Membrane was probed against GFP and ubiquitin in order to determine the ubiquitination status of the tFT-Pex15Δ30. Of note, degradation resistant lower molecular weight tFT intermediates (
Khmelinskii et al., 2016) were not detected on the western blot shown (see
Figure 2B for details).


