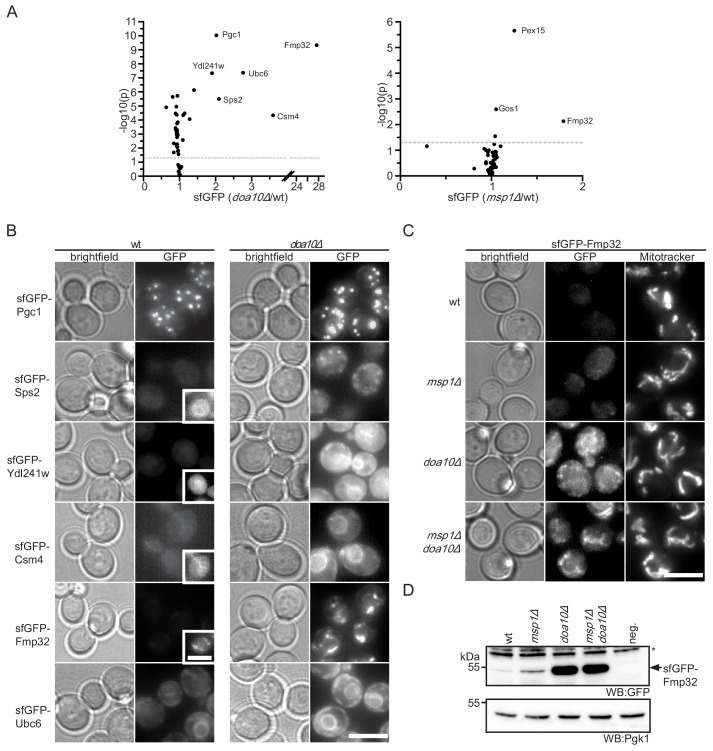
Figure 5. Doa10 controls targeting fidelity of mitochondrial TA proteins.
(A) Mean GFP fluorescence of 55 N-terminally GFP-tagged TA proteins expressed from NOP1 promoter deleted for DOA10 or MSP1 compared to wt. Measurements were taken from colonies grown on agar (n = 4). Highlighted proteins are significantly enriched (Student’s t-test p<0.05, threshold gray dashed line). (B) Microscopy validation of significantly enriched proteins from (A) in wt compared to doa10Δ. Images for each protein investigated are shown with the same display range for wt and doa10Δ. Insets show optimized display range. Scale bar: 5 μm. (C) Microscopy analysis of sfGFP-tagged Fmp32 under its endogenous promoter. Mitochondria are stained with the mitochondrial dye Mitotracker Red. Scale bar, 5 μm. (D) Western blot (WB) analysis of log phase growing yeast from (C). neg. is a wt yeast referring to GFP specific bands. Unspecific bands are marked with star. Pgk1 is used as loading control.
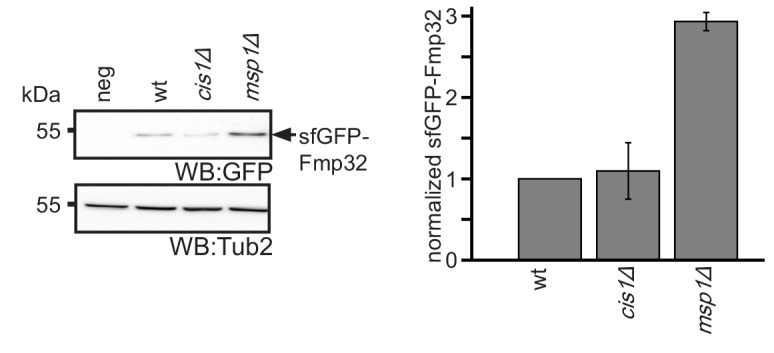
Figure 5—figure supplement 1. Msp1 does not require Cis1 for Fmp32 turnover.


