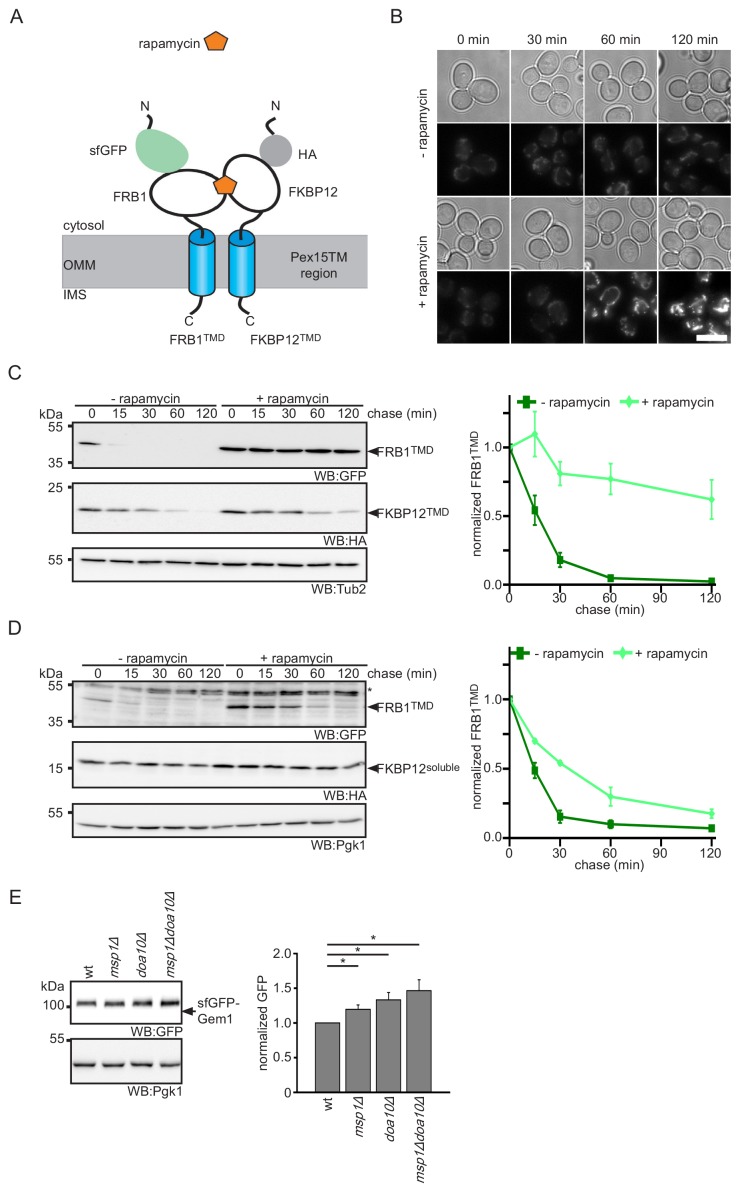
Figure 6. Protein dimerization impedes Msp1-dependent extraction.
(A) Scheme of rapamycin-induced dimerization for the two reporter proteins FRB1TMD and FKBP12TMD. (B) Microscopy analysis of wt yeast expressing FRB1TMD and FKBP12TMD. Images were taken with and without rapamycin treatment for the indicated time. Scale bar: 5 μm. (C) Cycloheximide chase of strains from (B) with and without rapamycin pre-treatment for 30 min. Quantification of FRB1TMD (n = 3, ± SEM) normalized to t = 0 of untreated sample. WB, western blot. Tub2 is used as loading control. (D) Cycloheximide chase of strains expressing FRB1TMD and cytosolic FKBP12 (FKBP12soluble) with and without rapamycin pre-treatment for 30 min. Quantification of FRB1TMD (n = 3, ± SEM) normalized to t = 0 of untreated sample. Unspecific bands are marked with star. Pgk1 is used as loading control. (E) Steady state analysis of sfGFP-Gem1 expressed from the NOP1 promoter in wt, msp1Δ, doa10Δ and msp1Δdoa10Δ with quantification (n = 6 ± SEM, star indicates Student’s t-test p<0.05).


