
Figure 1. Evolved clones exhibit increases in cell width and length.
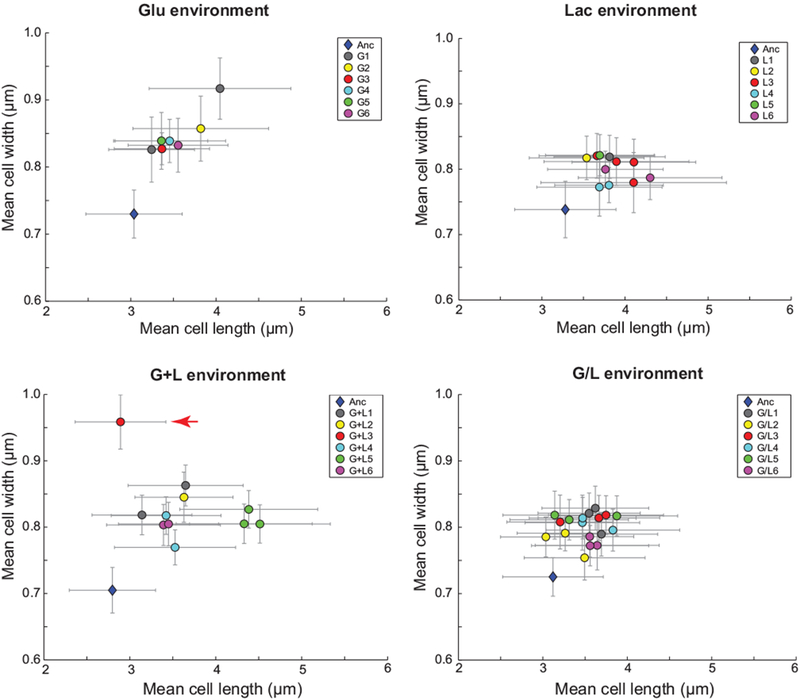
Clones from each of the 24 evolved populations were imaged during exponential growth in their respective evolution environments: Glu, Lac, G+L, or G/L. The nomenclature for evolved clones follows an Ex-y format, where E is the environment (G, L, G+L, or G/L), x is the population and y is the clone isolated from this population. Clones are colored by population and some populations are represented by more than one independent clone (e.g. G1 has two clones, G1-1 and G1-2). An ancestral control is plotted for each environment (blue diamond). Clone G+L3 (clone isolated from the third evolved population in G+L) exhibited the largest width increase and is marked with a red arrow. Error bars represent standard deviations of the population distributions.