
Figure 2. The mreBA53T allele results in an increase in cell width and volume.
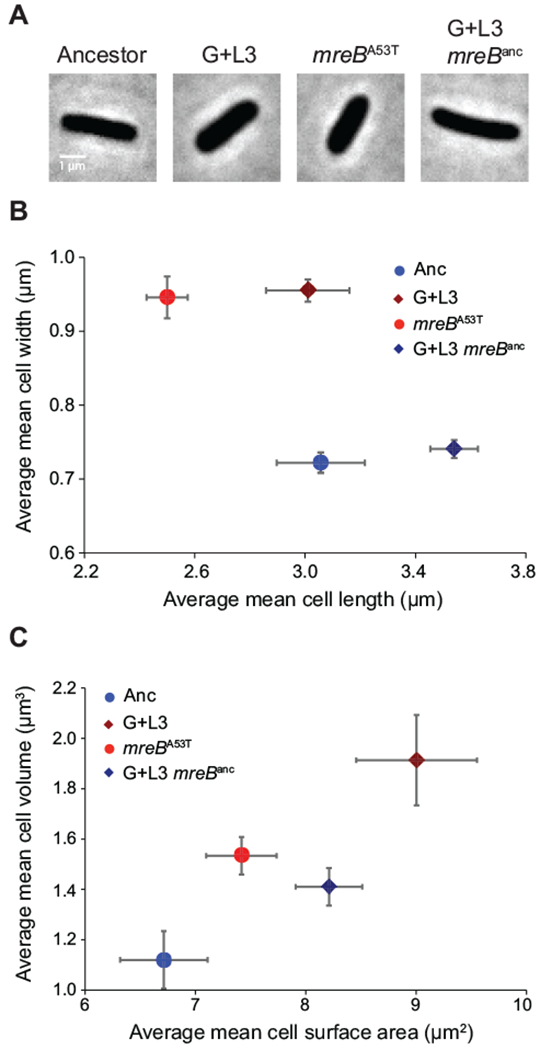
A) Phase-contrast images of the ancestor (Anc), the evolved clone (G+L3), the ancestor carrying the mreBA53T allele (mreBA53T), and the evolved clone with mreB reverted back to the ancestral sequence (G+L3 mreBanc). B) Comparison of average mean cell width and length for each strain during exponential growth in Davis minimal medium plus glucose (DM+Glu). C) Comparison of average mean cell volume and surface area for each strain during exponential growth in DM+Glu. In (B,C), the ancestral and evolved strain backgrounds are represented by circles and diamonds, respectively. Blue symbols denote strains expressing the mreBanc allele and red symbols denote strains expressing the mreBA53T allele. All estimates of cell geometry are the average of three independent measures of population means derived from quantification of >200 cells. Error bars represent 95% confidence intervals (CIs).